


The famous market speculator Baron Rothschild said that the "time to buy is when there's blood in the streets." With the Russell Microcap Index down over -13% since the beginning of the year it raises the question of whether the U.S. equity market complex is at least ready for an oversold bounce or perhaps near the beginning of the next leg higher for the secular bull market.
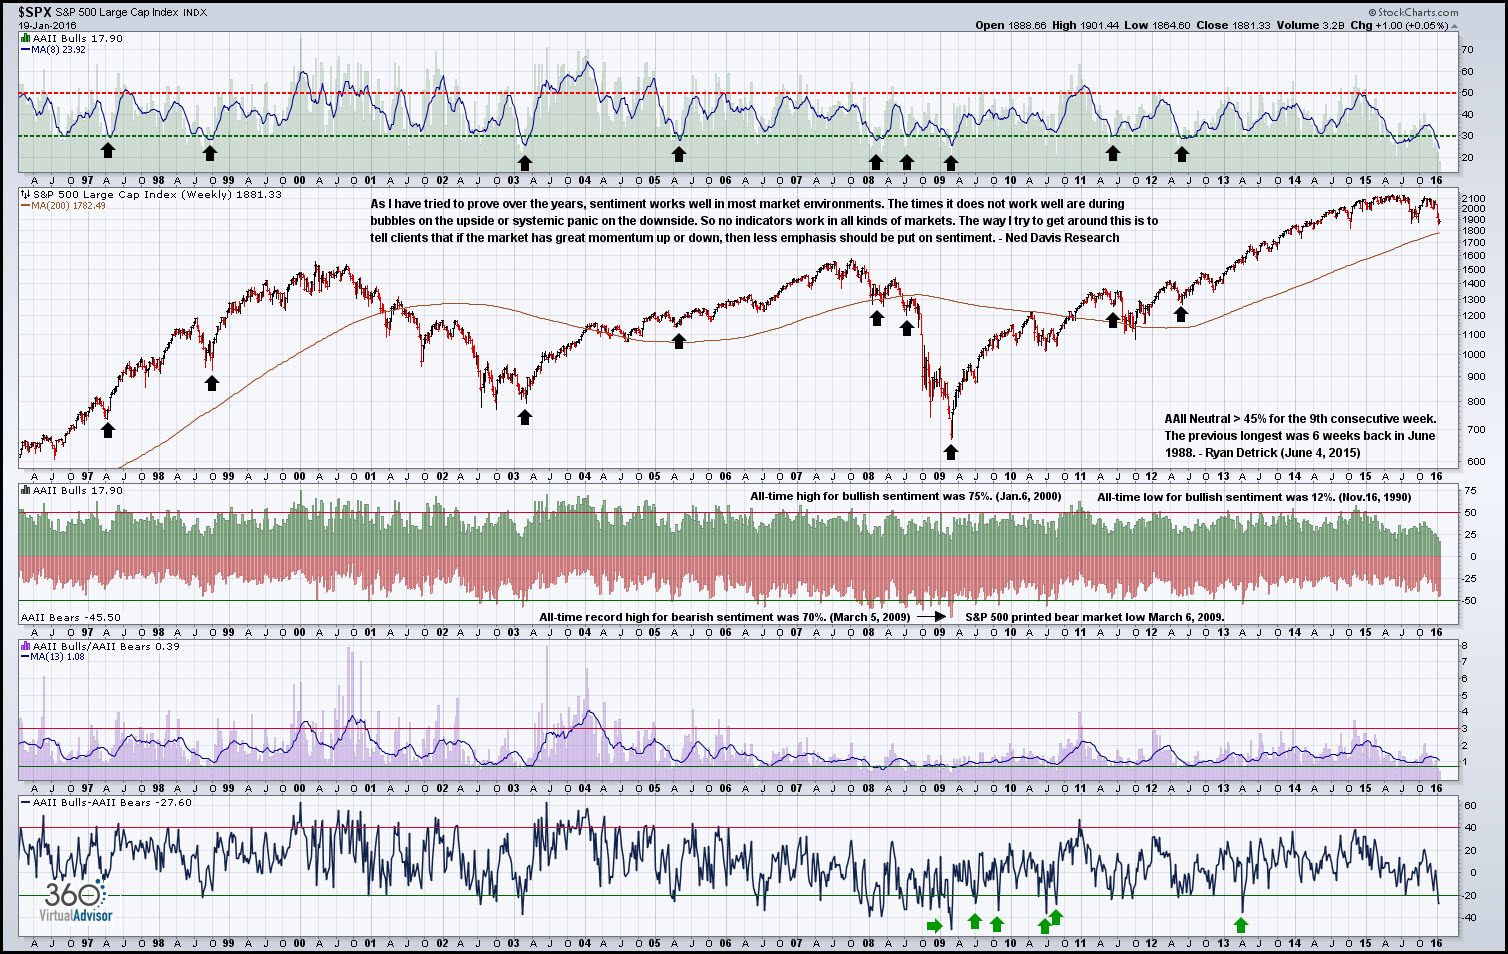
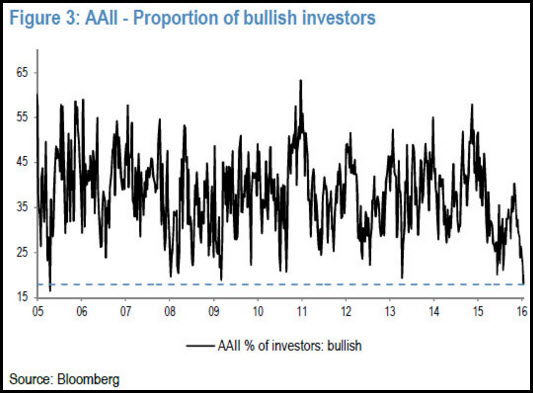
Over the weekend and even towards of last week I noted a growing legion of market experts and market researchers suggesting that the equity market would be turning higher sooner, rather than later. One of the metrics cited was the AAII Bull - AAII Bear ratio which closed last week at it's lowest level since 2013 and below the important -25% threshold.

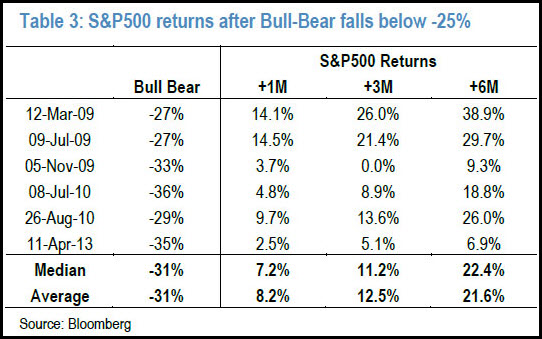
J.P. Morgan produced a small table categorizing returns on a 1,3 and 6-month basis following a reading below -25%. It is clear based on the very small sample size that the market should be much higher by mid-February.
However, if you turn back to the chart above you can also see that during the 2007-2009 bear market there were multiple readings below -25% and the downside momentum continued going out 1, 3 or 6 months.
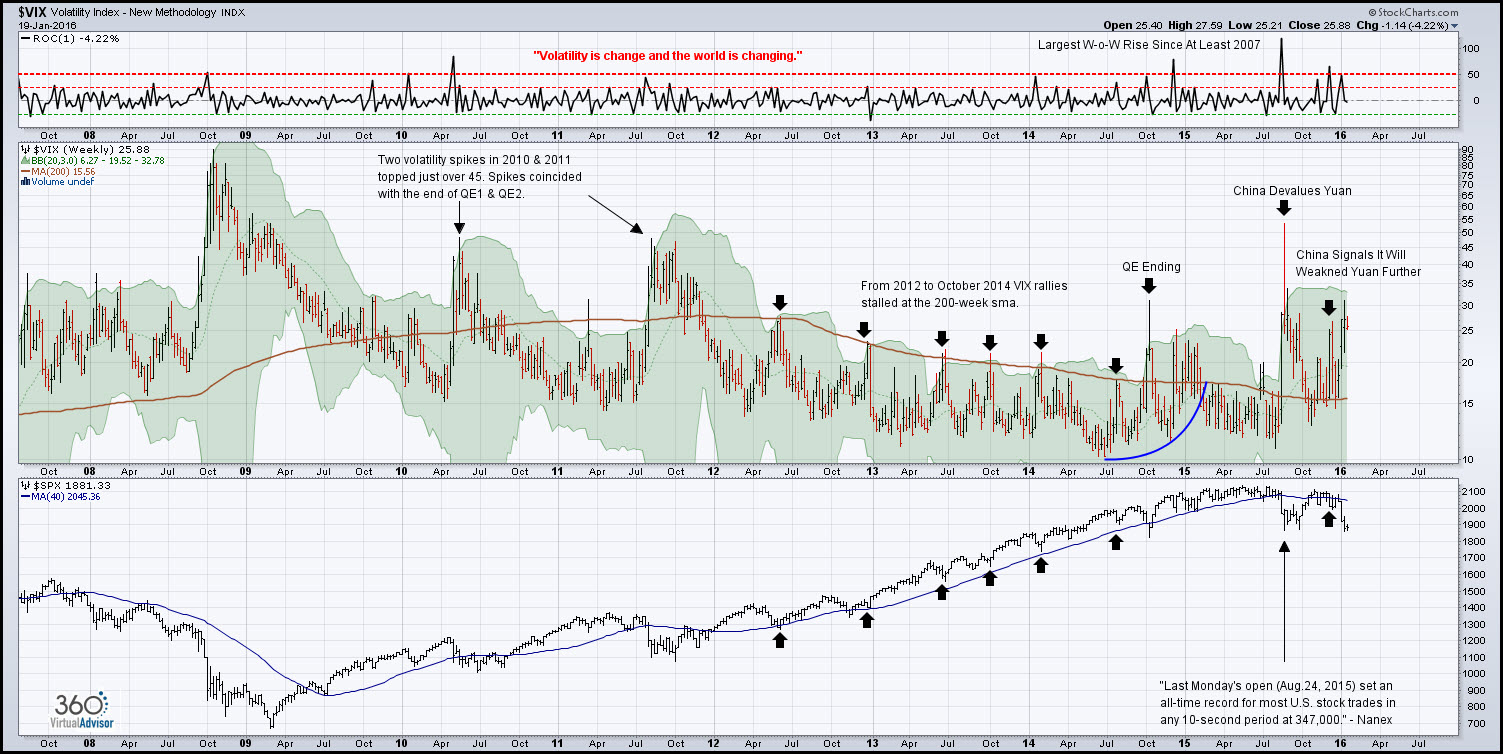
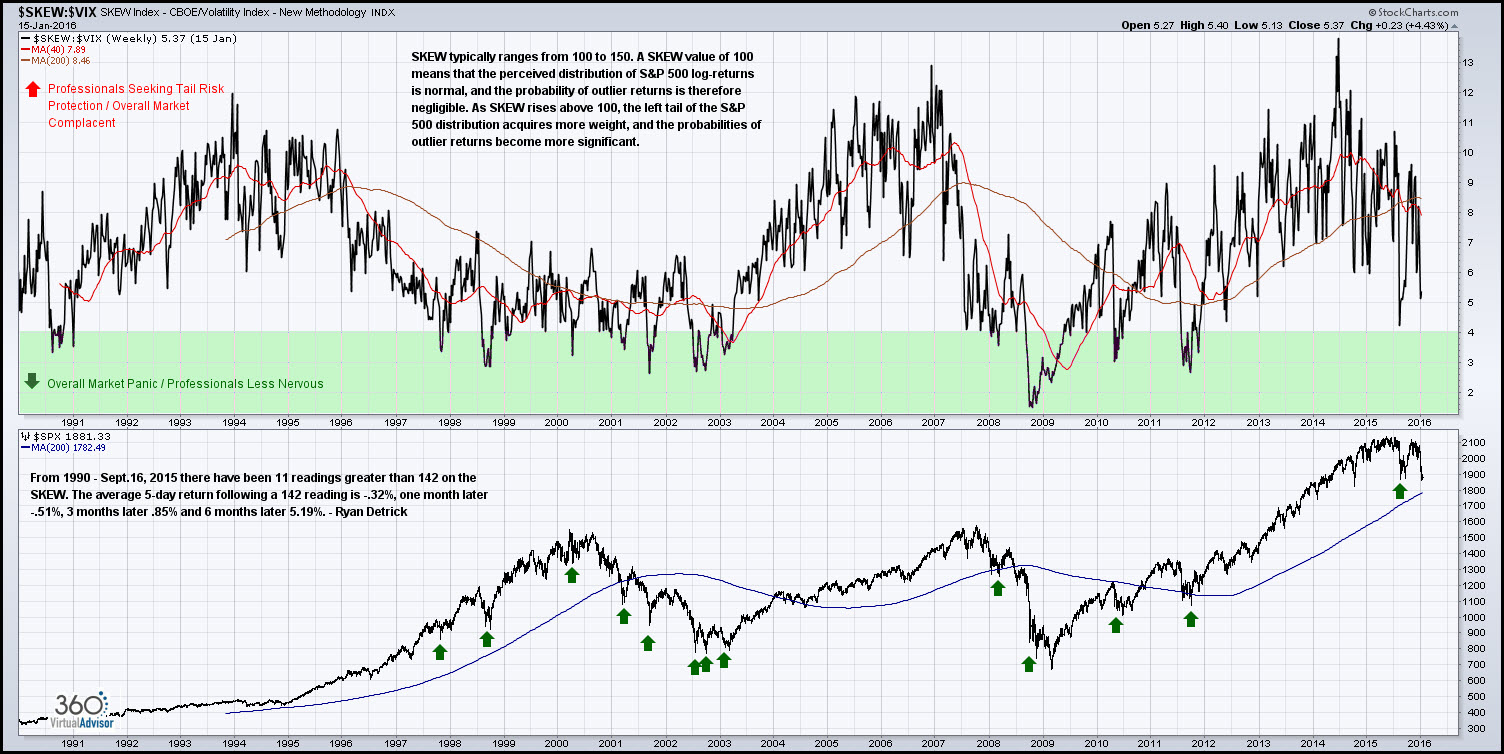
Another popular and often useful indicator is the VIX (Volatility Index). In my work I found that when the VIX spikes 3 STDs from the running weekly mean it signals at least a short-term bottom is near. As of today, and despite the notable declines this month, the VIX has yet to trade outside of the volatility bands. In short, the retail investor has yet to print a useful panic signal.
In an attempt to monitor the ebb and flow of market sentiment between the retail and professional market participants I refer to the SKEW : VIX ratio. A rising ratio indicates that the professionals are less market bullish (not necessarily bearish) than the retail investor. When the ratio becomes handy is when the it drops below 4, because it indicates that the retail investor has entered a panic, liquidation phase. So far this month the reading has failed to decline below 4.
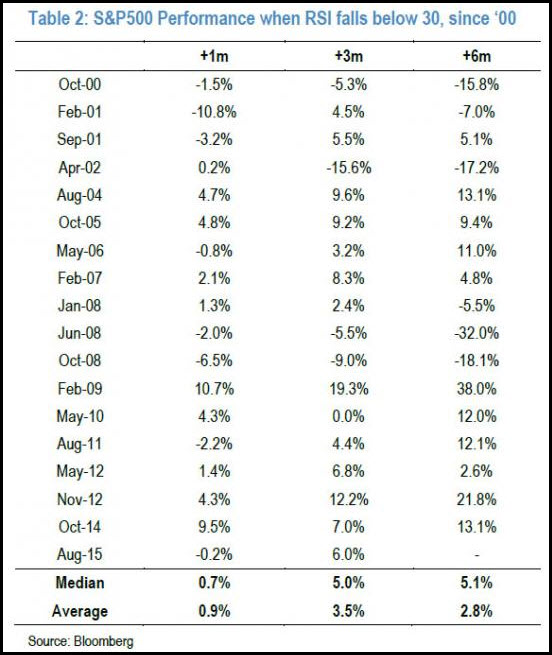
A timing model I've used for years is the 'Blood In The Streets' or BITS panic signal. The model is based on the RSI falling below 30. If the indicator drops below 30 it has shown good results picking at a tactical low.
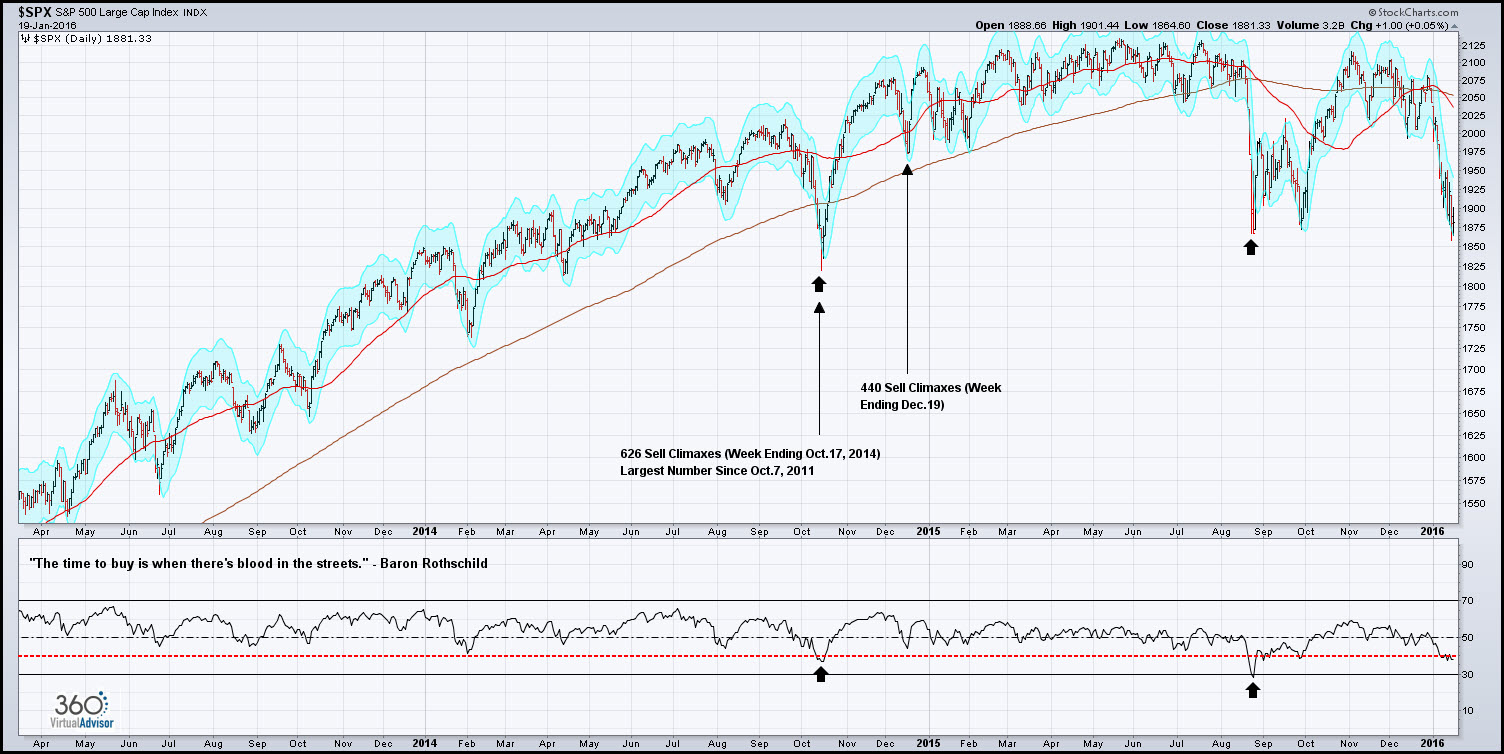
Too much surprise this weekend I discovered that J.P. Morgan uses the same indicator and even went to the trouble of cataloging the gains going out 1, 3 and 6 months. The quantified returns are not stellar, but confirm that the signals do alert market participants to solid tactical trading opportunities.
There you have it, some indicators / metrics say go long right now and others suggest that the panic has yet to reach extremes. Let me be clear, there is no science to picking market bottoms or defining the peak panic moment in the equity market. If there were....well, you know the rest. In my opinion it is an art as much as anything else.
If this is the beginning of a much bigger market decline then the value of sentiment indicators shifts from 'at the margin' to irrelevant on all counts. I think Ned Davis says it best.
"As I have tried to prove over the years, sentiment works well in most market environments. The times it does not work well are during bubbles on the upside or systemic panic on the downside. So no indicators work in all kinds of markets. The way I try to get around this is to tell clients that if the market has great momentum up or down, then less emphasis should be put on sentiment." - Ned Davis Research
© 2024 Benzinga.com. Benzinga does not provide investment advice. All rights reserved.
Trade confidently with insights and alerts from analyst ratings, free reports and breaking news that affects the stocks you care about.

