Editor's note: This is part one of a two-part series. To read the second part, click here.
Stocks were hammered again on Monday as the momentum names continue to be punished.
The question of the day, of course, is if the huge declines seen recently in names like Amazon.com AMZN, Tesla TSLA, Twitter TWTR and Yelp YELP will cause the "meaningful correction" in the broad market indices that just about everybody on the planet is looking for.
We could spend the rest of our pixels this morning making predictions about what is likely to happen next.
Getting the BIG Moves Right
Late last week, it was discussed the importance of getting the really big, really important moves in the stock market right. Looking at the past 20 years shows that investors would have made a pretty penny staying invested in the stock market.
In fact, from 6/1/1994 through the beginning of April, a buy-and-hope investor in the S&P 500 SPY cash index would have made +325.14 percent.
We went on to note that although a gain of +325 percent is nothing to sneeze at, one COULD actually do much better if they managed to capture 70 percent of the bull market gains and avoided one-half of the bear market losses.
Some simple math showed that while such an approach missed a fair amount of upside and got hit with some of the downside, the +325 percent gain could hypothetically be improved to +450.5 percent.
Graphically, such an approach is kinda/sorta illustrated in the chart below as the first rectangle drawn on the monthly chart of the S&P 500 covers about 70 percent of the bull market gain. In essence, the game plan it to grab "the meat" out of the major uptrends.
S&P 500 Monthly from 1994

Of course, one of the caveats we have discussed is that achieving such a result is easier said than done, as it is very tricky to (a) get the turning points correct and (b) avoid getting faked out when a substantial correction occurs.
So, we had promised to provide an idea or two that could help investors get the really big, really important moves right.
A Simple Monthly Trend-Following System
Before we launch into the approach, we should state that what we are about to present is a very simple system and that all results presented are purely hypothetical.
The numbers in this report do not represent actual trading and do not take into account commissions, taxes, slippage, interest on money market etc. It should also be noted that this does not utilize a specific approach as there are definitely pitfalls to using any single indicator.
However, if all an investor wants to do is stay on the right side of the really big moves, this simple monthly trend-following approach does the job, for the most part. And the good news is the investor would only need to look at the market on the last day of each month.
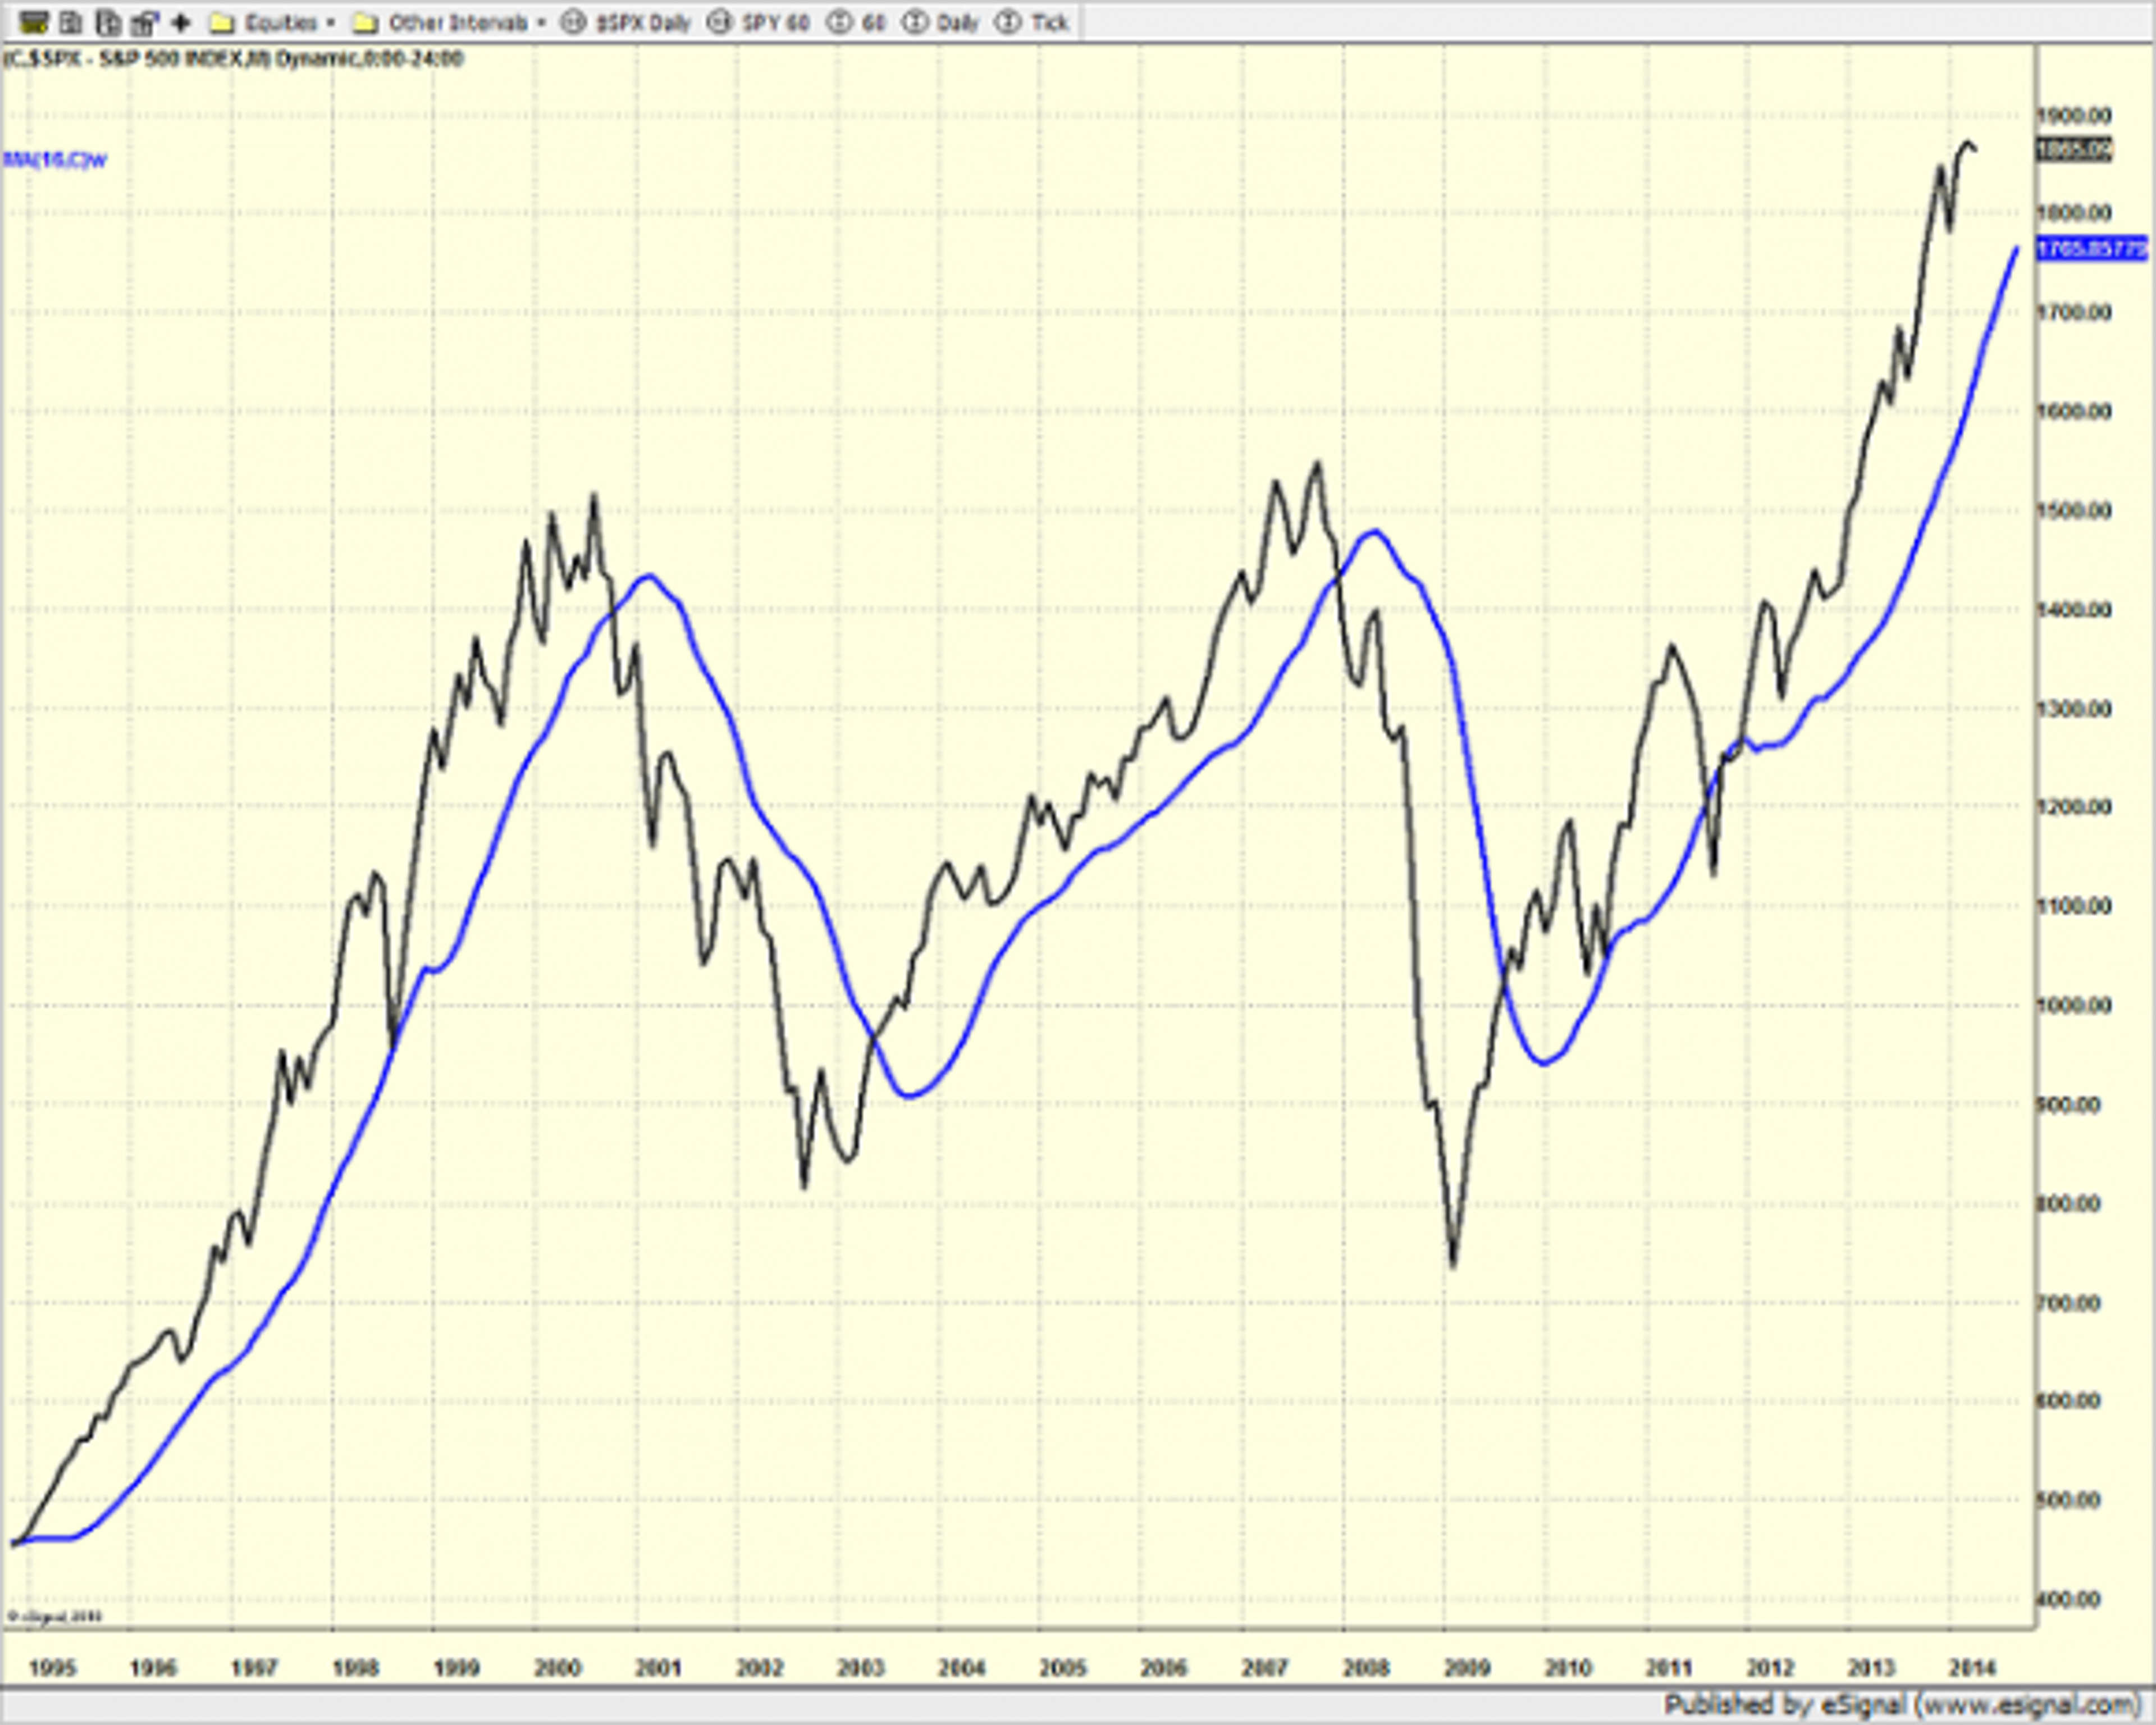
The idea is to apply a 16-month, weighted, moving average to a monthly chart of the S&P 500.
Then we move the moving average forward five months. You can think of this as sliding the moving average to the right a bit. The moving average is the blue line on the chart below.
S&P 500 Monthly from 1995
In case you are not familiar with the concept, moving the MA forward helps avoid whipsaws, such as the 1998 emerging markets crisis that wound up spanning just a couple of months.
The Strategy
The idea is simple. If at the end of each month, the S&P 500 is above the 16-month, weighted, moving average that has been moved forward five months, you remain invested in the S&P. And if the S&P is below the MA, you stay in cash.
Easy, right?
Below is a chart showing the hypothetical monthly results of using such a strategy from 1995 through 3/31/2014. Again, this is a backtest of the strategy and should be used for "proof of concept" only.

As you can see, the simple monthly trend-following system does indeed improve results over the buy-and-hope approach: +546 percent vs. +308 percent.
The cumulative return is also little better than our original goal of capturing 70 percent of the upside and missing half of the downside, which produced a hypothetical gain of +425 percent over a similar period.
In reviewing the annual returns of the hypothetical backtest, you can see that the system wound up losing money in 2000 but then stayed in cash during the remainder of the 2000-02 bear market. As such, the system lost -10.5 percent during the bear market, which is a big improvement over the market's decline of more than -40 percent.
Then in 2008, the system lost just -1.44 percent versus the -38.5% decline seen in the S&P 500. Thus, it is clear that such a system did a nice job in preserving capital in the two brutal bears that occurred since the turn of the century.
What's the Catch?
However, the trade-off to the approach is quite evident in 2003 and 2009. In order to avoid getting whipsawed during the big, bad bear markets, such an approach is always going to be a bit late in getting you back into market after the bear has ended. Therefore, underperformance during the year following a bear market is to be expected.
Then the other problem with such a system is a year like 2011, where the market first moved down violently and then moved right back up in an equally violent fashion over a very short period of time. Thus, the quick whipsaw created a fairly substantial loss on the year.
But again, all in all, the system does a pretty good job of accomplishing our base-level goal.
But Can't We Do Better?
Everyone who has ever tested a system for managing the stock market knows that once you find something that works, the next step is to see if you can improve on the concept.
So, tomorrow, we'll take a look at taking this simple, monthly trend-following system up a notch or two by (1) incorporating short positions into the mix and then (2) adding some leverage.
Positions in stocks mentioned: SPY
Click here to read part two of this series on "Getting The Big Moves Right"
© 2024 Benzinga.com. Benzinga does not provide investment advice. All rights reserved.
Trade confidently with insights and alerts from analyst ratings, free reports and breaking news that affects the stocks you care about.

