


Late to the bull party? Nearly half of S&P 500 stocks continue to show no significant trend breakthroughs to date.
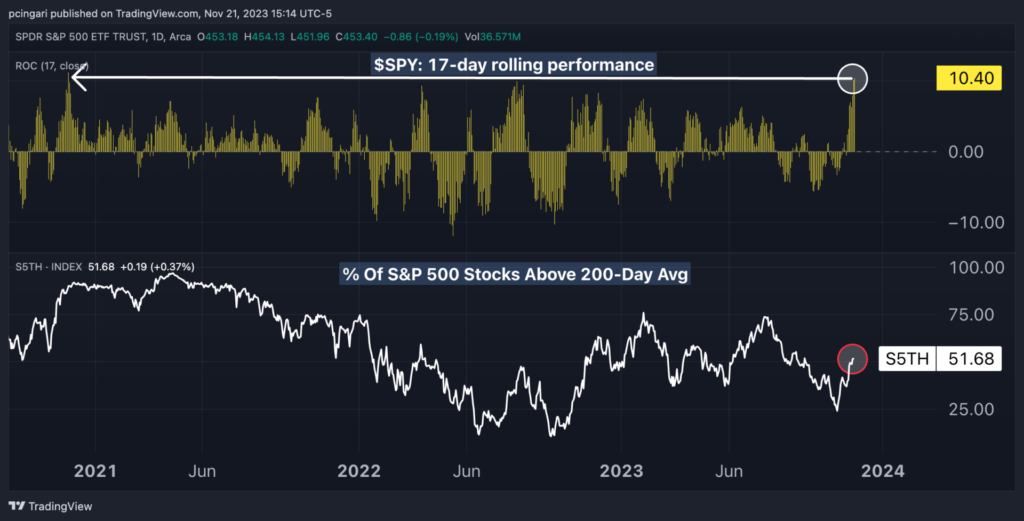
What Happened: SPDR S&P 500 ETF Trust SPY gaining over 10% since Oct. 27. This marks the index’s strongest 17-day rally since November 2020, a surge initially fueled by the Covid-19 vaccine breakthrough.
The year-to-date return for the broader market now stands at 18%, nearly doubling the 30-year average annual return of 9.862%. However, this bullish sentiment isn’t uniformly reflected across the board.
Surprisingly, only about 52% of S&P 500 components are currently trading above their 200-day moving average, often viewed as a key technical determinant of a stock’s long-term trend.
Rewind to November 2020, a comparable rally saw 90% of S&P 500 stocks trading above their 200-day moving average.
Chart: S&P 500 Had Its Best 17-Day Rally Since November 2020

Top 10 S&P 500 Stocks With The Widest Discounts
Only about 52% of S&P 500 components are currently trading above their 200-day moving average, despite the robust rally of the past weeks.
Some stocks — EPAM Systems Inc. EPAM, Citigroup Inc. C, Quest Diagnostic Incorporated DGX, and Agilent Technologies Inc. A — are hovering near these levels. Others are lagging considerably behind.
The table below reveals the 10 S&P 500 stocks exhibiting the largest price discrepancies when compared to their 200-day average levels.
| Name | Last Price | % Distance vs. (200-Day Avg.) |
|---|---|---|
| SolarEdge Technologies, Inc. SEDG | 78.87 | -64.91% |
| Illumina, Inc. ILMN | 95.72 | -46.74% |
| FMC Corporation FMC | 53.11 | -44.98% |
| Enphase Energy, Inc. ENPH | 98.16 | -37.97% |
| Paycom Software, Inc. PAYC | 178.38 | -37.31% |
| The Estée Lauder Companies Inc. EL | 120.10 | -36.44% |
| Albemarle Corporation ALB | 125.97 | -36.37% |
| Moderna, Inc. MRNA | 77.42 | -35.96% |
| Align Technology, Inc. ALGN | 215.07 | -30.99% |
| Walgreens Boots Alliance, Inc. WBA | 20.87 | -28.27% |
Risk of Value Traps?
A stock significantly below its 200-day moving average may indicate either a potential bargain or a fundamental issue with the company.
A value trap occurs when a stock appears to be cheap but is actually fairly priced due to declining business prospects.
Therefore, it’s crucial to differentiate between a stock that’s undervalued due to market overreactions and one that’s declining due to underlying business problems.
In conclusion, despite being a a powerful tool for understanding long-term market trends, the 200-day moving average also has its own limitations. It’s a lagging indicator, meaning it reflects past price movements and may not accurately predict future trends.
Read now: Magnificent 7 Take Center Stage In Hedge Fund Portfolios: Analysts Warn Of Extreme Concentration
© 2024 Benzinga.com. Benzinga does not provide investment advice. All rights reserved.
Trade confidently with insights and alerts from analyst ratings, free reports and breaking news that affects the stocks you care about.

