Back in November I pointed to the Value Line Geometric Index,RTH VALU as one of many reasons why I was bearish the U.S. Stock Market. One of many, but definitely a good one. You see, when we look at cap-weighted indexes like the S&P500 or Nasdaq100, the components with the largest market capitalization have the heaviest weighting in the index. This allows relative strength in some of the largest companies to hide what is actually happening underneath the surface. It doesn’t tell the entire story.
By looking at the Value Line Geometric Index, which consists of around 1700 names and assumes an equal dollar amount invested in each stock covered by Value Line, we get a much more broad based look at the U.S. Stock Market. This isn’t Microsoft and Google hiding what the smaller components (“the real world”) are doing. This is, “OK what does the market look like overall right now?”. This gives us a real world view that is not swayed by scared institutional money flowing towards the mega-caps. This is the real deal.
As I mentioned in November, a big reason why I was bearish was because the Value Line Index failed to hold above the former highs from 1997 and 2007. From failed moves come fast moves in the opposite direction, and as usual, down we went. This combined with bearish momentum divergences all over the place made it awfully difficult to go into December bullish an already broken U.S. Stock Market.
Today I wanted to give an update on where the Value Line Geometric Index sits today. Here we are looking at daily chart going back to the 2012 correction lows. The scary part is that the 3-month period starting in November and ending at the end of January is actually the most bullish 3-month period for U.S. Stocks throughout the entire year. This index went straight down during that time, which suggests there are larger market forces at work. This index, and others, are in a lot of trouble:
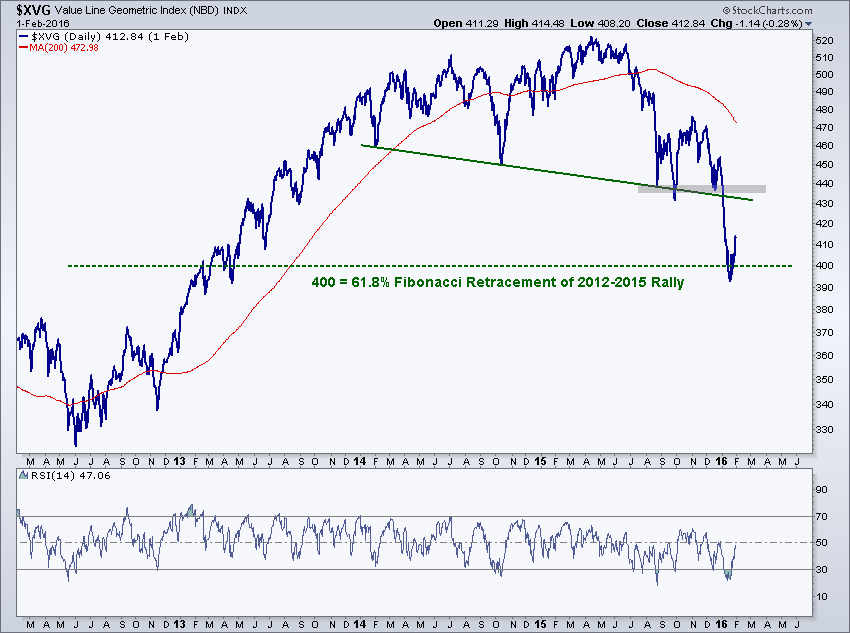 We are attempting to bounce from the 61.8% Fibonacci retracement of the 2012-2015 rally, and I do think it might have some legs. The problems, however, are two-fold (or 20-fold if you really want me to get into it). First of all, on these new lows last month, momentum confirmed by putting in new lows of it’s own, rather than diverging positively as it did last September. This suggests lower prices are ultimately coming.
Second of all, we have a ton of overhead supply up near 435-440 from former support in August, September and again in December. Any strength towards those levels will run into supply. This is the, “Please just get me back to break even” crowd. This is the, “I’ll never make a stupid trade again, just please get me back to break even” crowd. This massive group of bag holders are sitting there waiting, begging, praying for a rally to sell into. We want to sell into that with them, not be the suckers buying it from them.
So what does this tell us? More bad news, like what we saw in November. We want to be sellers of strength in stocks if/when we get back up towards that former support. This isn’t over. It looks like things are going to get worse before they get better and any counter-trend rallies we see are just that: counter-trend.
This was originally shared on All Star Charts
© 2024 Benzinga.com. Benzinga does not provide investment advice. All rights reserved.
Comments
Trade confidently with insights and alerts from analyst ratings, free reports and breaking news that affects the stocks you care about.

