Most of the sentiment and position metrics that we monitor, and highlight on the pages, are viewed as contrary indicators. That is, once they reach an extreme, investors or traders would be wise to act “contrary” to the extreme. In other words, the crowd is wrong at extremes. At least that is generally the case, historically speaking. There are a few exceptions to that rule. One such exception can be found in the traders of S&P 100, or OEX, options. Historically, this group has been on the right side of the market more times than not when their collective options position is at an extreme. This may be something to take note of as OEX traders have never held more put options relative to call options as they do right now.
Specifically, when measuring the open interest in OEX options, Friday’s readings marked the first time ever with more than 3 put options for every call option. Today’s reading came in even more extreme at 3.3 puts for every 1 call. A look at the chart over the last 16 years illustrates truly how extreme these readings are.
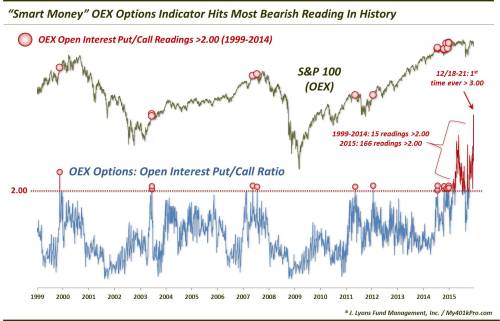
As we noted in our last update on this indicator in April, these elevated readings have become more frequent as well as more extreme. It used to be that we viewed readings above 2.0 as extreme. From 1999-2014, there were just 15 days that registered a reading above 2.0.
What is so significant about those extremes in OEX open interest put/call readings? They were almost all accurate in forewarning of struggles in the stock market. In late 1999 and mid 2007, the extreme readings preceded cyclical market tops. In mid-2011, the extreme occurred prior to the sharp summer decline. And while readings in June 2003 and late 2014 did not precede major weakness, the stock market did stagnate for several months following. Perhaps only an occurrence in January 2012 proved to be a complete bust as a warning sign.
Then, there’s 2015. After 15 readings above 2.0 in 15 years, there have been no fewer than 166 readings that high so far in 2015. What gives? Either it truly is “different this time”…or this is an unprecedented red flag waving in front of us.
One factor that has been brought up in regards to the indicator and its potential effectiveness is volume. While OEX used to be a standard-bearer in terms of an equity index options contract, this is no lnger the case. Volume is a fraction of what it once was. This seems like a genuine reason to treat the signal with a grain of salt. That said, volume has been dwindling for years and, for the most part, the signals have remained pretty accurate.
So what’s our takeaway? With OEX volume as depressed as it is now, the bearish connotations of an elevated reading in the OEX open interest put/call ratio are perhaps mitigated to a degree. Even so, when we see readings so far stretched beyond even former extreme levels, we still think it’s worthwhile to take notice. As we said in the April post, looking at the current readings on the chart is like looking at Wilt Chamberlain’s 4th grade class picture.

“stairs with a warning” photo by shino.
“Wilt Chamberlain 4th Grade Class” photo by Unknown.
This post was originally shared on Dana Lyons' Blog.
More from Dana Lyons, JLFMI and My401kPro.
The commentary included in this blog is provided for informational purposes only. It does not constitute a recommendation to invest in any specific investment product or service. Proper due diligence should be performed before investing in any investment vehicle. There is a risk of loss involved in all investments.
© 2024 Benzinga.com. Benzinga does not provide investment advice. All rights reserved.
Comments
Trade confidently with insights and alerts from analyst ratings, free reports and breaking news that affects the stocks you care about.

