


In October, Jack Dorsey announced he was coming to the rescue and rejoining as CEO, even though he was already the CEO of Square which went public in November. The stock rose 20% on the news, and then a week later the company announced their first ever layoffs and the stock has continued to slide from there.
TWTR now trades around $23 a share, off 37% for the year and 70% for the past two years. It’s about half of its IPO price from November of 2013. So, what in the world makes Twitter our top projection for the next month?
The chart below represents the last 3 months trading in Twitter. Let’s take a look….what are your impressions

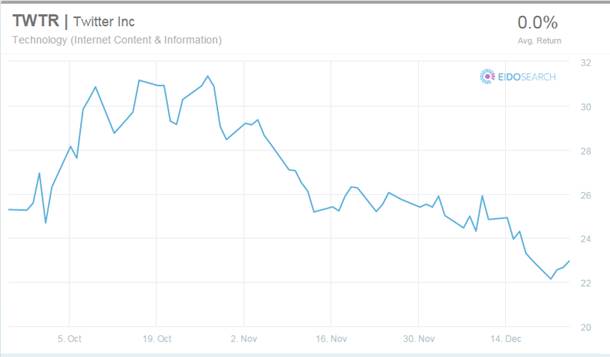
The experienced investor may have seen this trading behavior before in a stock or many stocks, maybe even with Twitter itself, and forms an opinion about what might happen next. We remember if the stock recovered or continued down, and that informs our impression of the current situation.
EidoSearch uses the same approach, meaning we use past experiences to inform our judgement about the future. However, we take the subjective nature out of this by using mathematics and scale. We look through hundreds of millions of patterns to not only inform an opinion but to provide statistics and probabilities.
So, back to the question of why in the world is Twitter our best 1 month projection? We’ve seen this trading pattern over a 3 month pattern in peer stocks historically many times before, and the statistics strongly suggest a price recovery in the next month per the project chart below.

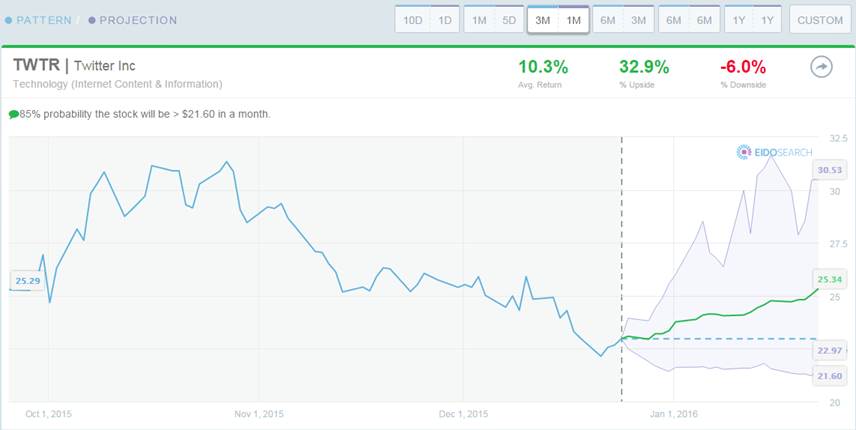
When considering the fundamental story of Twitter, we should pause to think probabilistically. Having a better anchor is a distinct advantage. There is 85% probability that Twitter will be above $21.60 (no worse than a 6% drop) in one month, with 5.5x the upside to downside. The average return of all similar instances of this pattern in technology stocks historically is 10.3%.
Now, if you don’t believe in the fundamental story then you’re not going to invest anyway. If you do like the fundamentals, Dorsey’s turnaround plan, strategy for growth, etc., then this is valuable information. The average of ALL similar instances of this pattern in all trading environments since the 1970’s and regardless of whether the company was sound or about to go bankrupt is 10.3%. The risk premium to invest now suggests little downside with great upside. What we’re basically saying is if you like the company, the statistics are well in your favor.
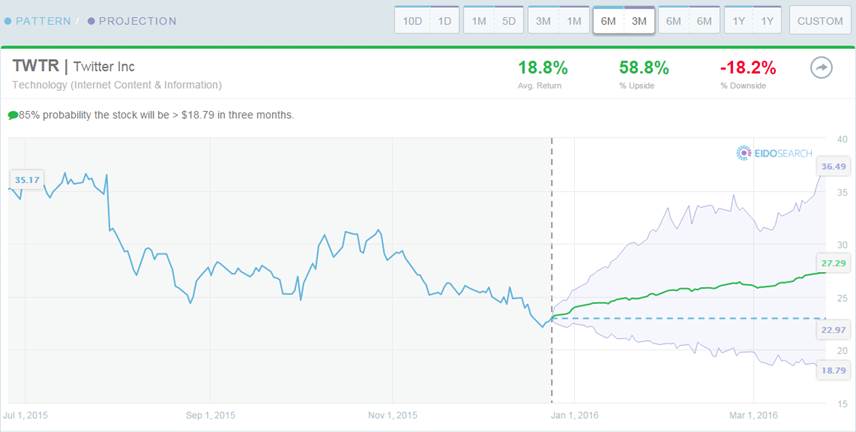
How about 3 months out? Twitter is still the 17th ranked out of the 600 largest U.S. stocks:
Have a safe and happy New Year!!!
© 2024 Benzinga.com. Benzinga does not provide investment advice. All rights reserved.
Trade confidently with insights and alerts from analyst ratings, free reports and breaking news that affects the stocks you care about.

