


In last week’s Dow Thirty report, JC Parets and his team at Eagle Bay Solutions look into Johnson & Johnson JNJ weekly and daily (for Friday) charts. Below, the main takeaways:

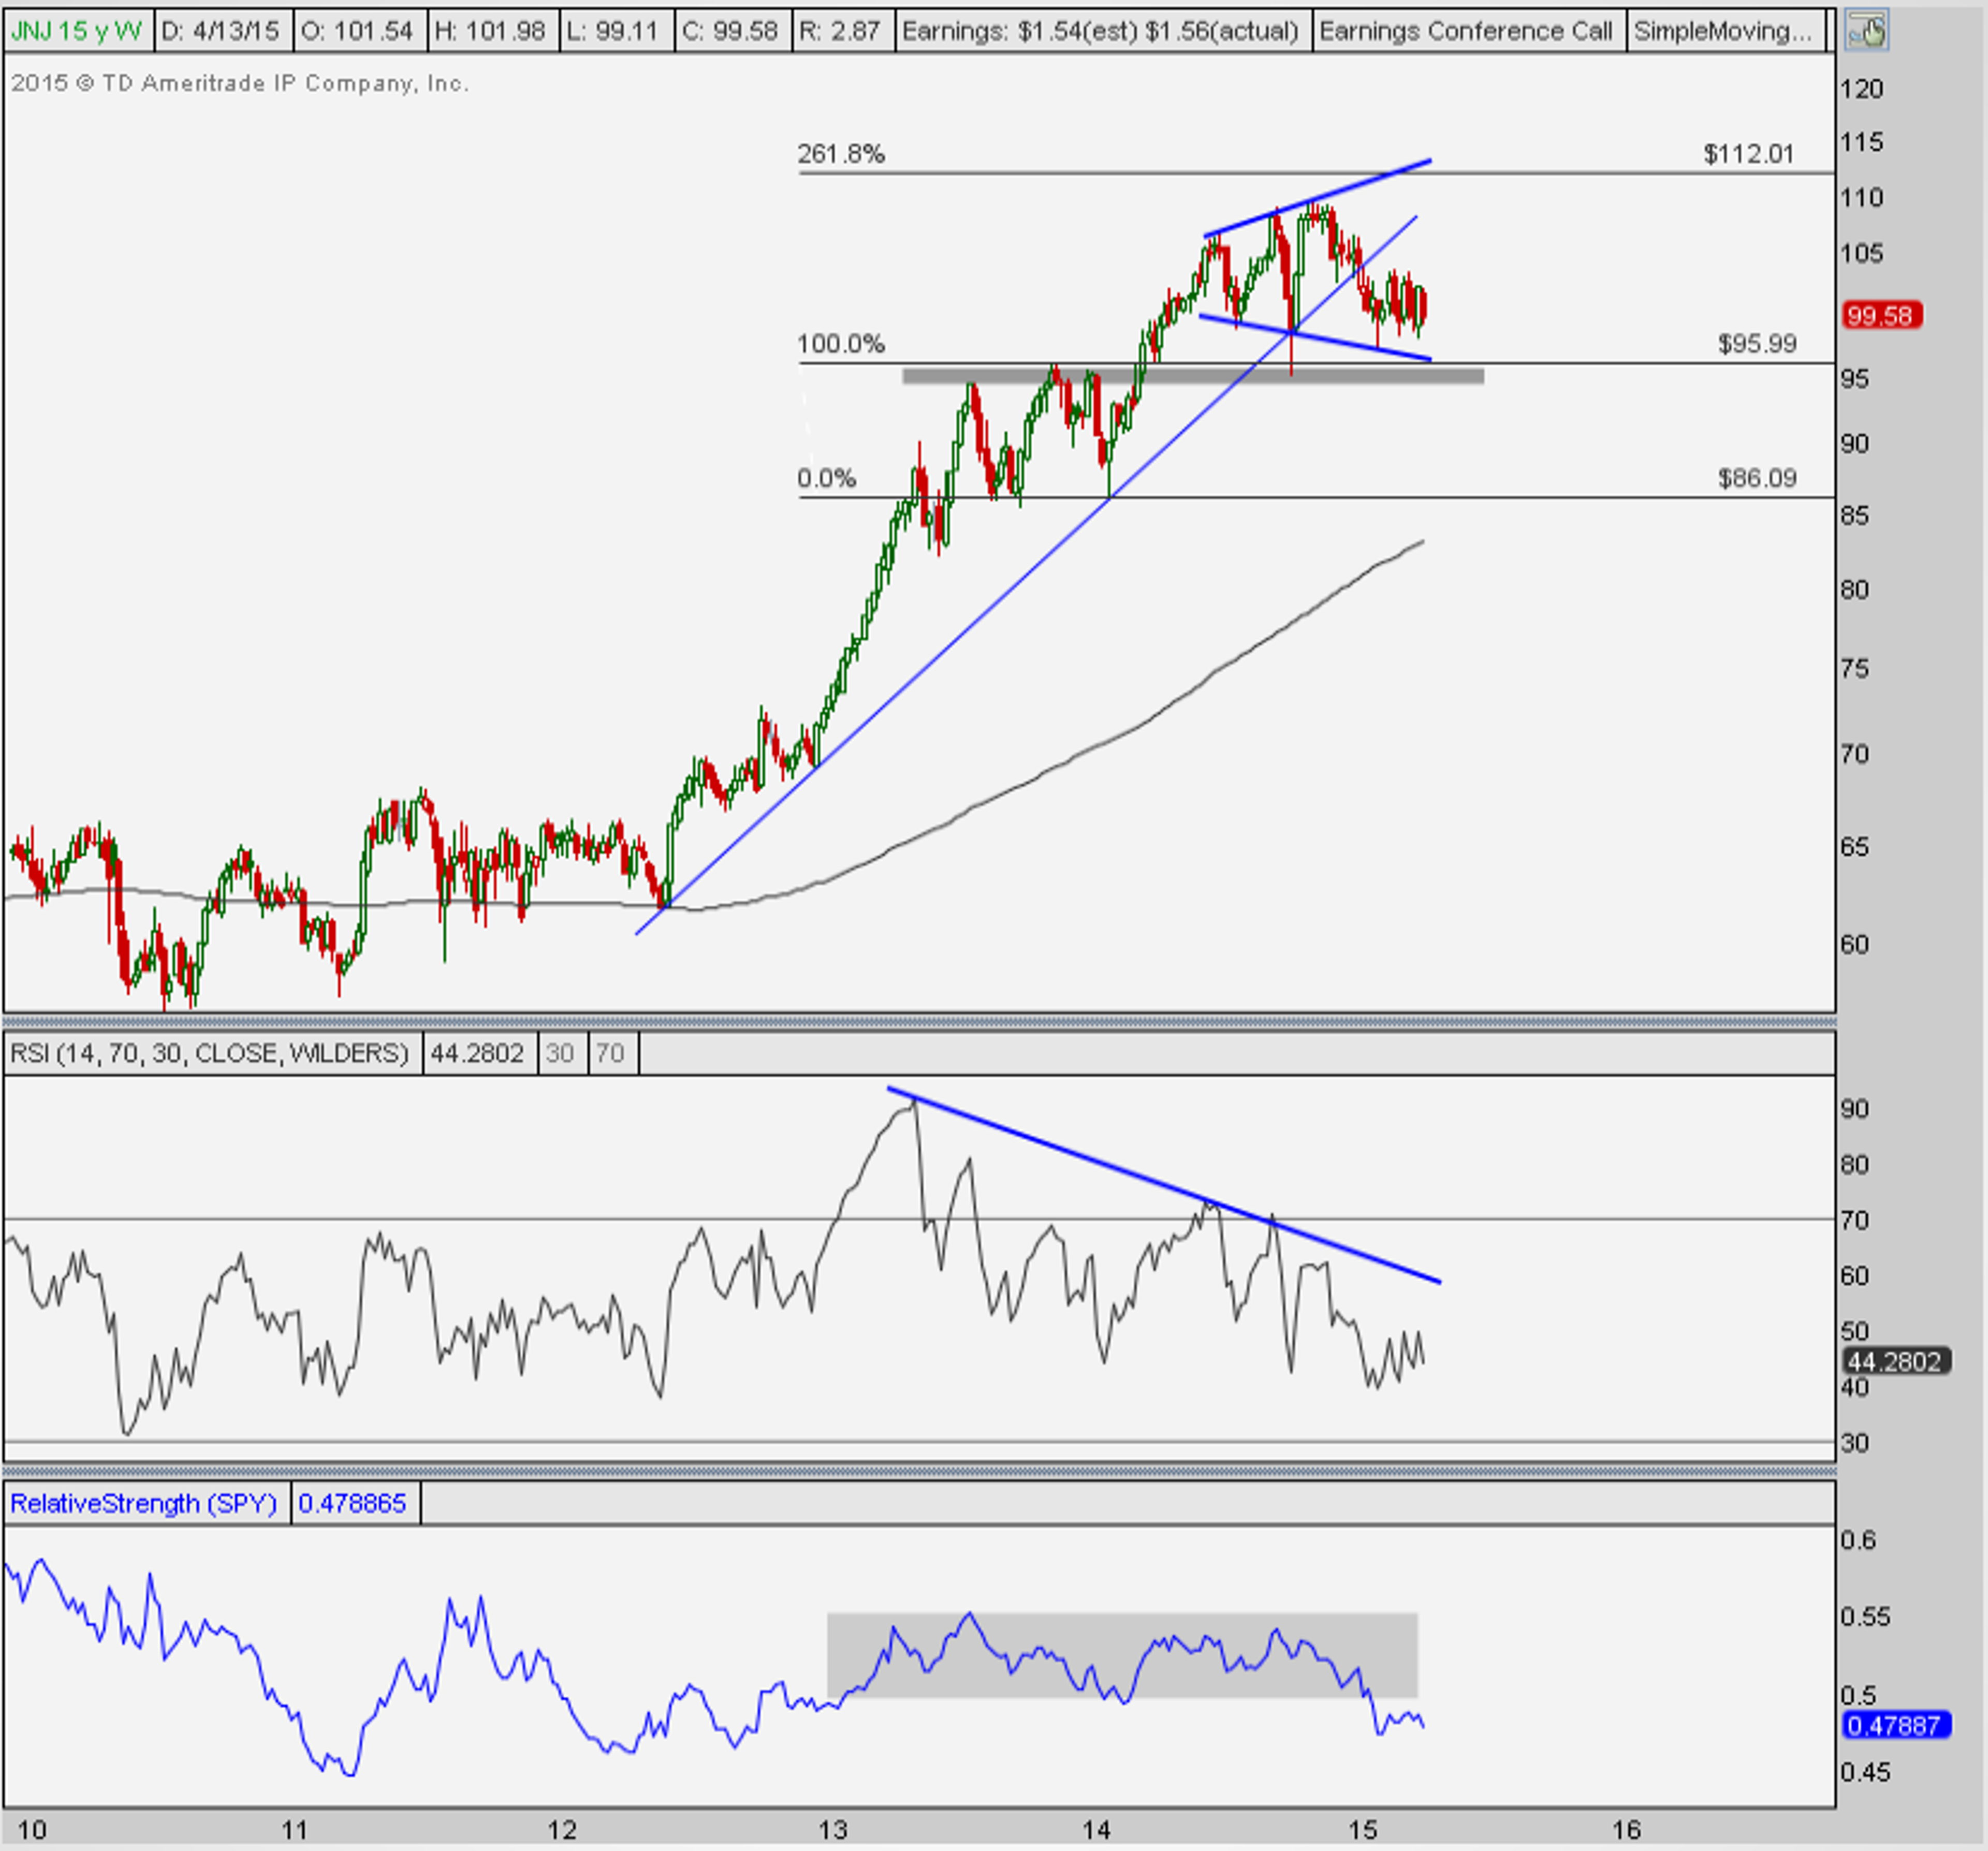
From examining the above chart, the analysts conclude that Johnson & Johnson, structurally, has experienced one of the greatest uptrends in the Dow Jones Industrial Average (INDEXDJX:.DJI). They explain that “the bearish momentum divergence at recent highs” has led them to maintain a more neutral standpoint. Furthermore, they continue to trade in that range, “although in what is looking more and more like a broadening top, which is traditionally bearish.”
Related Link: 2 Intel Charts This Pro Is Watching
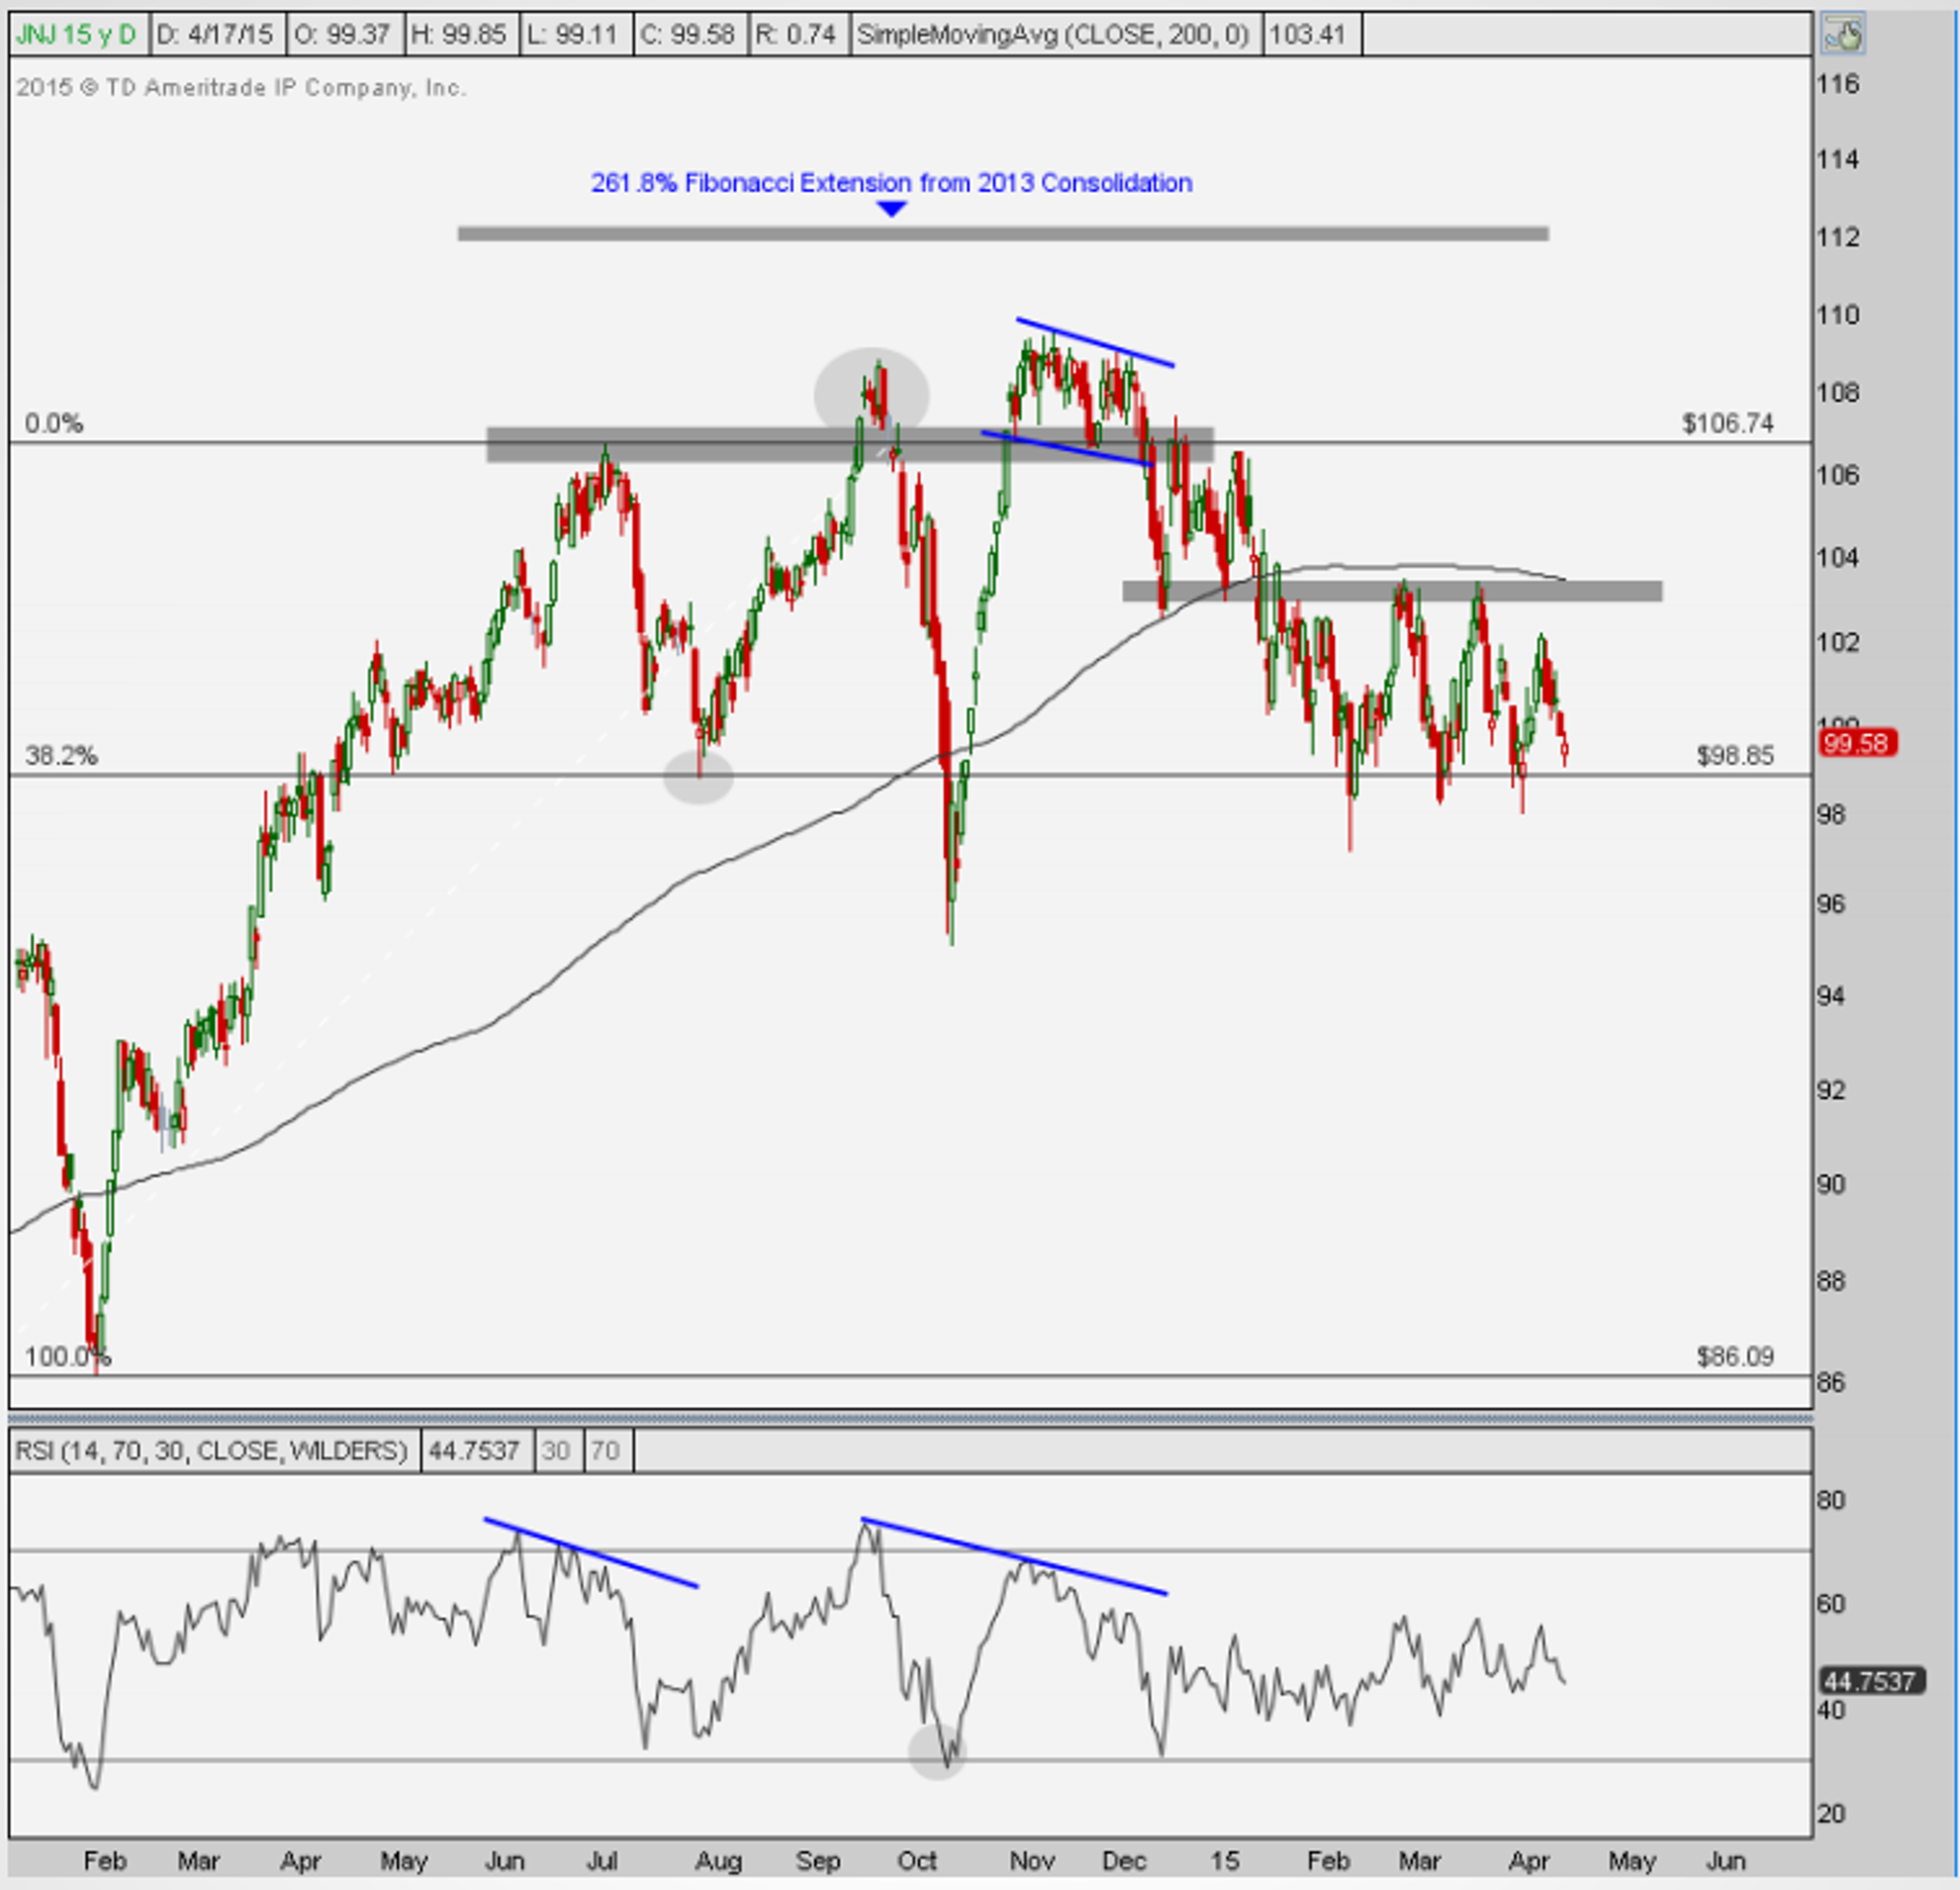
Parets breaks down the issue: “A break of the uptrend line from 2012 gave us downside targets in the mid-90s, which was support last year and resistance in 2013. If momentum breaks out above this downtrend line, it would be a positive. Below the 2012 uptrend line and I want nothing to do with it, particularly with momentum putting in bearish divergences. Relative strength also broke down below this 2-year range. I still don't like this and would continue to approach this more tactically” (see daily chart below).

Short-term, the firm said, back in November, that “prices were flagging above former resistance and a breakout above the upper of the two parallel lines defining this small channel would confirm that is a continuation pattern and” they want to add to longs on this breakout.
Related Link: 2 Microsoft Charts Worth Watching
However, the report continues to explain, “when bullish patterns resolve negatively, the market is telling us that larger forces are at work, and that in fact a short-position on a breakdown below the lower of the two trendlines would make a great trade.” And, this is precisely what happened; and shorts could remain so below the highs hit on December 19.
Parets’ conclusion: “This confirmed a bearish momentum divergence and have felt that this market was in trouble. Our downside target near 99 was hit in February. This was based on support last summer and 38.2% Fibonacci retracement of the 2014 rally. I would still maintain a more neutral stance now, especially below a flat 200 day moving average. A bearish development would be a break of recent lows that would take prices down under 96 based on October support and former resistance early last year.”
© 2024 Benzinga.com. Benzinga does not provide investment advice. All rights reserved.
date | ticker | name | Price Target | Upside/Downside | Recommendation | Firm |
|---|
Trade confidently with insights and alerts from analyst ratings, free reports and breaking news that affects the stocks you care about.

