


Long-wick candlestick on the weekly chart of the S&P 500 Index consistent with prior short-term peaks.
**NEW** As part of the ongoing process to offer new and up-to-date information regarding seasonal and technical investing, we are adding a section to the daily reports that details the stocks that are entering their period of seasonal strength, based on average historical start dates. Stocks highlighted are for information purposes only and should not be considered as advice to purchase or to sell mentioned securities. As always, the use of technical and fundamental analysis is encouraged in order to fine tune entry and exit points to average seasonal trends.
Stocks Entering Period of Seasonal Strength Today:

Northeast Utilities System NU Seasonal Chart
The Markets
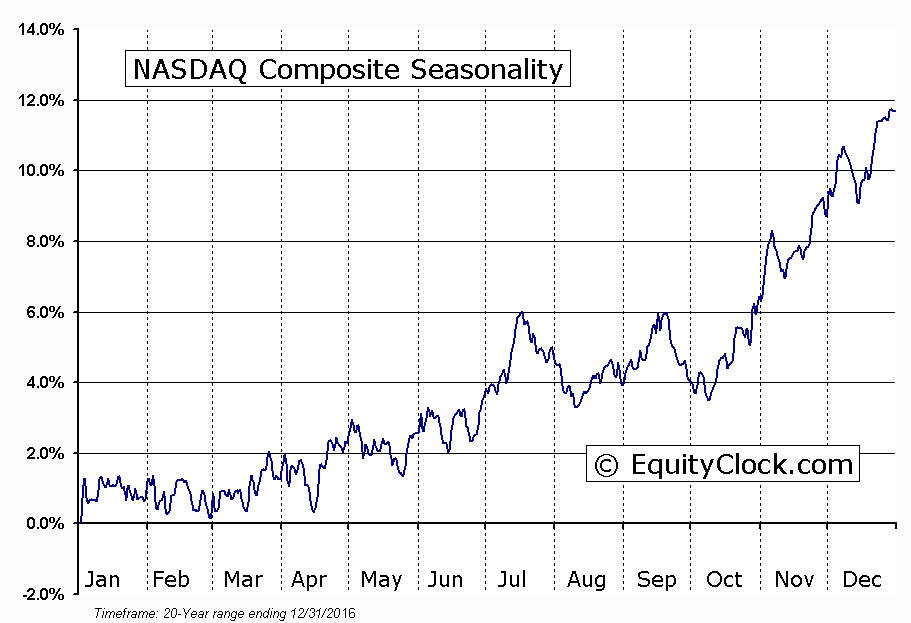
Stocks ended flat to close the week as major benchmarks struggled under the weight of a weak technology sector. Disappointing earnings from Microsoft and Alphabet acted as the catalyst to the move, keeping the tech-heavy Nasdaq Composite in negative territory throughout the session. The Nasdaq Composite came back to test support around its rising 20-day moving average as it battles with resistance around the open gap charted in January between 4900 and 5000. As with other indices, momentum indicators continue to roll over, suggesting waning buying pressures, but this does not mitigate the fact that benchmarks continue to maintain levels of support. Seasonally, the Nasdaq is typically stronger than other US indices into July as the biotech industry and the technology sector gain into the summer.

^IXIC Relative to the S&P 500


Shifting to the S&P 500 Index, the large-cap benchmark recorded a flat result to end the week, charting a rather indecisive doji candlestick. From a weekly perspective, the long wick candlestick highlights the range of resistance that is directly overhead. The candlestick pattern for the week shows similarities to prior short-term peaks in the market realized over the past couple of years. Historically, support has typically been found around 20 and 50-week moving averages, which are presently hovering around 1990 and 2030, respectively. These intermediate moving average levels would provide a logical point of support upon any retracement, should it be realized. Momentum indicators on the weekly chart continue to point higher and have yet to show signs of peaking.


Aside from the weakness in the technology sector, another headwind to the market continues to emerge. Following a bounce from the lower limit of a declining trend-channel, the US Dollar index is showing a short-term double-bottom pattern around horizontal support of 93. A break above resistance just above 95 would suggest a swift move higher to around 96, potentially testing resistance around its 50-day moving average. Momentum indicators are curling higher, hinting of a change in trend, at least for the short-term. Commodities would be particularly vulnerable to a shift in the domestic currency, hints of which were realized with the pronounced declines in metal and agricultural commodities during Friday's session. The FOMC meets on Tuesday, providing a significant catalyst, one way or the other, in influencing the currency. Seasonally, the US Dollar Index tends to strengthen in the month of May, turning back higher following a negative April.


Sentiment on Friday, as gauged by the put-call ratio, ended close to neutral at 0.98.

Sectors and Industries entering their period of seasonal strength:

STAPLES Relative to the S&P 500


FUTURE_FC1 Relative to the S&P 500


Seasonal charts of companies reporting earnings today:


S&P 500 Index


TSE Composite


© 2024 Benzinga.com. Benzinga does not provide investment advice. All rights reserved.
Trade confidently with insights and alerts from analyst ratings, free reports and breaking news that affects the stocks you care about.

