


Loading...
Loading...
Keep it simple and see the coming food-energy price spiral. The FAO Food Index and EIA oil index show a very high correlation of 0.93, according to this graph plotted by
Paul Chefurka.
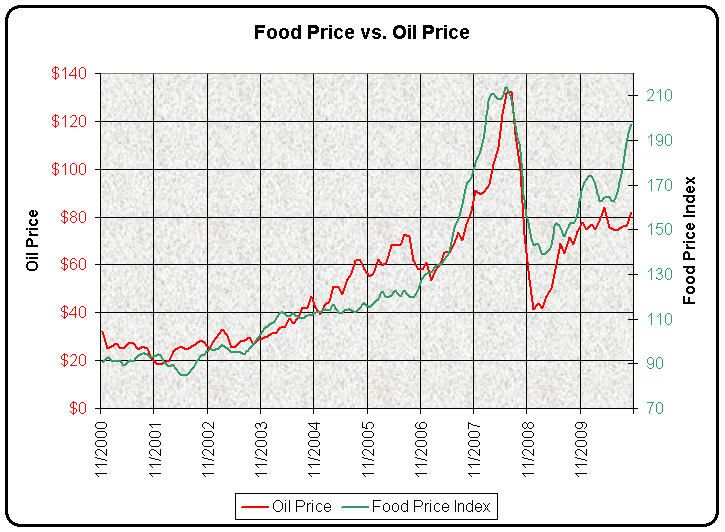
GRAPH: Food prices doubled in the last 11 years while oil rose more than 150%. Data: Nov 2000 to Nov 2010 by EIA, FAO. Chart courtesy Paul Chefurka
As global protests have spread to
Saudi Arabia oil prices are destined to lead the next step up and remain high. The possibility of supply disruptions by either a closure of the Suez Canal or riots getting out of hand in Saudi Arabia will put in a solid floor at current levels.
This does not bode well for food prices. Check some 11.1 million Go ogle results for "
rising food prices" or look at your latest grocery bill.
Forget about seemingly stable "core" ex food/energy inflation and tepid "consumer price indices" with overweighted consumer electronics and underweighted everyday needs. No human being can fight inflation by stopping to eat and no business can cut its energy consumption deliberately. Riots in Africa are not for cheaper iPads but stable food prices.


© 2024 Benzinga.com. Benzinga does not provide investment advice. All rights reserved.
Benzinga simplifies the market for smarter investing
Trade confidently with insights and alerts from analyst ratings, free reports and breaking news that affects the stocks you care about.
Join Now: Free!
Already a member?Sign in

