In late October of 2007 the Russell 2000 small cap index was trading around 800. The index hasn't returned to that level since.
Now, over two years later, small caps are once again close to touching this psychologically important level.
We often look at the Russell since it's a benchmark index for small-caps. And with the index closing out the year closer than ever to its pre-recession high, it's a good time to review technical indicators that can clue us into the strength of individual stocks.
Yesterday I introduced three technical patterns - double tops and bottoms, head and shoulders, and triangles - that you can use to help you make profitable investments.
Today, we'll look at flag and pennant patterns, and tomorrow we'll review wedges and gaps.
Remember, we use technical analysis with fundamental analysis, not as a substitute. Together the two methods give us a strong understanding of what is going on with a particular company, and the company's stock price.
1. Flags and pennants: The patterns known as flags and pennants are similar to triangles (discussed in yesterday's article) in the sense that the patterns are created by changes in the trading range's breadth. They are both considered as continuation patterns and are most often seen when price levels are consolidating. The two terms-flags and pennants-are often used to mean the same pattern. However, a flag is likely to be shaped as a rectangle, and a pennant is shaped more like a triangle.
The flag is characterized by a significant price movement and then a sideways pattern. It concludes most often with a price breakout (above resistance for upside continuation, or below support for downside price trends). The initial price spike is called the flag pole, and the horizontal trend is the flag itself. Descriptions of flags as continuation patterns are very helpful in understanding the meaning of the pattern.
For example, once the horizontal movement begins, technicians believe the flag is flying at half-mast, anticipating the subsequent price movement to continue the trend. In other words, the half-mast time is a consolidation in the middle of the trend.
The distinction between flags and pennants is found in the breadth of the trading range. In the flag, the overall trend may be evolving upward or downward, but the breadth remains the same (thus the rectangular shape).
Once price levels break above resistance, a buy signal is normally triggered. Conversely, in a downtrend, once price falls below support, a sell signal is triggered.
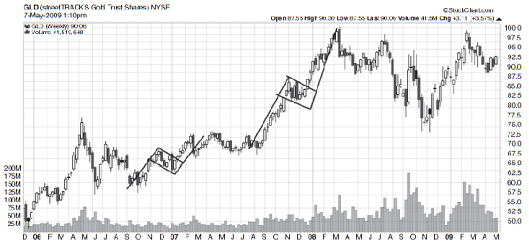
The chart below shows the SPDR Gold ETF GLD, which tracks the price movement of gold, in 2007. At this point, the ETF formed two bull flag patterns. Both times the patterns played out perfectly. The result was huge gains for any investor who bought GLD during the flag formation.
Bullish Flag Pattern
The pennant shares all of the flag's attributes with one important distinction: The trading range changes over time, often further characterized by a series of tests of resistance (in up-trends) or support (in downtrends) and possibly also signaling a reversal if and when double tops or bottoms occur as part of a pennant pattern.
The shape of the flag or pennant depicts bullish or bearish trends (see illustration below). Note how the pattern occurs in the middle of an established direction in all cases; these flags and pennants are pauses for consolidation before the established trends resume.
Bullish or Bearish Flags or Pennants

Just like most things, understanding technical patterns like flags and pennants takes practice. But to a trained eye, a stock chart can give the astute investor an idea where the stock price may go. Practice before you act, and gain confidence. You'll be glad you did when you start to make profitable trades.
© 2024 Benzinga.com. Benzinga does not provide investment advice. All rights reserved.
Comments
Trade confidently with insights and alerts from analyst ratings, free reports and breaking news that affects the stocks you care about.

