Are you sitting down?
Rick Davis recently wrote, “Unless the economy begins to pick up quickly, a double dip is likely — with the second round milder but lingering longer than the first.” How can our Sense on Cents Hall of Famer make this projection?
Rick sheds tremendous insights on the credit contraction ongoing and seemingly worsening in our nation’s economy. Davis paints a cogent picture as to how we are within weeks of the 2010 economic slowdown being worse than the 2008 recession at the same point in the cycle. You think I’m exaggerating? Hats off again to the fabulous work done by Rick Davis at Consumer Metrics Institute. Let’s navigate.
July 13, 2010 – Behind the Credit Numbers:
During the past week there has been a flurry of Federal Reserve reports and commentary concerning the levels of credit in the current economy. The two most notable were:
► On July 8th they reported that the level of seasonally adjusted outstanding U.S. Consumer Credit (their G.19 report) decreased during May by $9.1 billion, representing an annualized rate of credit contraction of 4.5%. Although even this change is above the average for the preceding twelve months, it is much smaller than a quiet revision to the previously published April U.S. Consumer Credit figure — which is now reported to have decreased by $14.9 billion (a 7.3% annualized contraction rate).
To put these numbers in perspective, consumer credit has contracted during 15 of the past 16 reported months, and is down a record total $148 billion over that time span. The $14.9 billion in credit ‘lost’ during just April is the second highest monthly amount in history, second only to the $23.4 billion ‘lost’ during November, 2009. And the nearly 6% cumulative reduction in consumer credit over the past 16 months is the largest (on a percentage basis) for any 16 month span since September 1944 — when FDR was still in the White House and people were buying War Bonds instead of tightly rationed consumer goods.
► On July 12th Federal Reserve Chairman Ben Bernanke noted that small businesses were not getting the loans that they need to create new jobs. The Federal Reserve’s own data reports that lending to small businesses dropped to below $670 billion in Q1 2010, down about $40 billion from two years prior.
The New York Times reported Mr. Bernanke wondered: ‘How much of this reduction has been driven by weaker demand for loans from small businesses, how much by a deterioration in the financial condition of small businesses during the economic downturn, and how much by restricted credit availability? No doubt all three factors have played a role.’
What does this mean?
► The reported credit contraction is real, at historic levels and on-going. Although the Federal Reserve does not yet know whether the most recent consumer credit contraction is the result of consumer pay-downs or credit company write-offs, the fact remains that consumer spending and the money supply are both being impacted negatively as consumers (one way or another) clean up their personal balance sheets.
► Small businesses, which account for over 60% of gross job creation, are not – for whatever reason – tapping into the credit necessary to create those jobs.
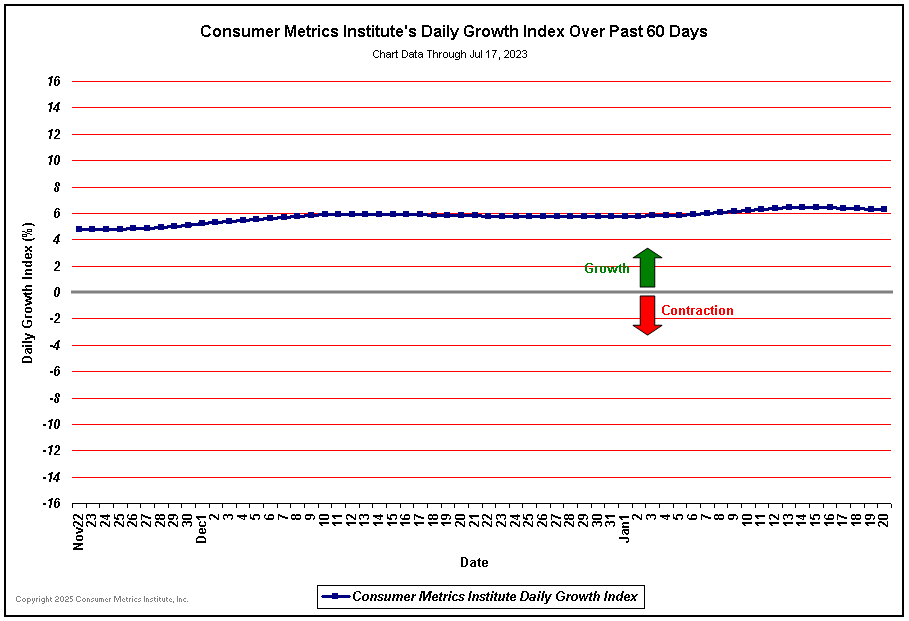
On July 6th we reported that the nearly relentless decline in our ‘Daily Growth Index’ had leveled off, but cautioned that the index should be viewed from a longer perspective. Since then the decline has resumed:
When the most recent period of contraction in our ‘Daily Growth Index’ (January 15, 2010 to date) is charted along with the similar ‘Daily Growth Index’ contraction events from 2006 and 2008 (with the first day of each contraction aligned on the left-hand axis) the relative severity of each contraction can be visualized.
One measure of the true severity of an economic slowdown is the ‘area under the curve’ (or ‘above’ the curve in this case) swept out by the ‘Daily Growth Index’ over time. This area is just the average magnitude of the decline times the duration of the contraction event. During the 2006 slowdown this area was about 136 percentage-days of contraction, while the 2008 event was much more severe at 793 percentage-days. The 2010 event has now reached 288 percentage-days, over twice the severity of 2006 and well over a third of 2008 ‘Great Recession’ — and it is still growing.
The key point to notice in the above chart is that if the current 2010 curve continues its current course, in about 20 days the 2010 slowdown will be more severe on a day-to-day basis than the 2008 ‘Great Recession’ was at the same point in its respective evolution. Unless the economy begins to pick up quickly, a double dip is likely — with the second round milder but lingering longer than the first.

Rick’s work is truly cutting edge. His GDP projections have proven to be amazingly prescient. I strongly encourage you to subscribe to Rick’s work. While you’re at it, you may want to subscribe to Sense on Cents as well via e-mail, an RSS feed, on Twitter or Facebook. Thanks!
LD
Related Sense on Cents Commentary
Sense on Cents/Rick Davis
© 2024 Benzinga.com. Benzinga does not provide investment advice. All rights reserved.
Comments
Trade confidently with insights and alerts from analyst ratings, free reports and breaking news that affects the stocks you care about.

