Reader David from the Garden State sent me an email last week after the hard selloff Thursday, to make an interesting observation. Those of you in the hard core technician group are familiar with Fibonacci - I've done a few posts on him in the past. Fibonacci's Wikipedia page is as follows:

Long story short, as part of the voodoo of technical analysis there are 3 key numbers:
Look at what happened in the S&P 500 in this selloff from the April peak. The rally in March 2009 began off infamous 666. It peaked at 1220. That is 554 points of gains. 38.2% of 554 = 211. (this is the first retracement) Take 211 points from the 1220 peak and what do you get? 1009.
Where did the market bottom? 1010.
Coincidence or spooky Italian math being propagated by thousands of supercomputers trading at 1/4000th of a second? You decide.
Here it is in chart form, you have to enlarge to see the figures because for some reason stockcharts.com decided it would be cool to make its Fibonacci numbers in light gray.
[click to enlarge]
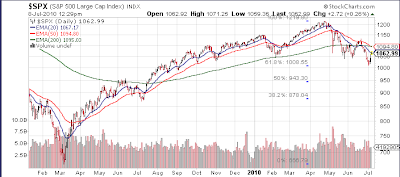
If one assumes there is more downside to come, the 50% retracement comes in at S&P 943 which coincides nicely with my mid 900s target. The 61.8% retracement would take us to S&P 878 which is a stretch target I am hearing from some of the most bearish folk i.e. mid 800s. Hence, if we begin a new leg down and the ultimate bottom is not the Doug Kass 1010 but instead something within a point or two of one of these other figures I'll have to give mad respect to the Italian math stallion.
Now I don't want to depress you, especially if you are the typical long only account and/or your financial advisor is giving you the same advice as he has since the 2000 top... "buy the dip, every dip!". On the other side of Fibonacci is perhaps a greater force. We call him "Kool Aid man". Kool Aid man's Wikipedia page is as follows.

Always two sides to every trade; let's see who ultimately comes out on top.


Market News and Data brought to you by Benzinga APIsLeonardo of Pisa (c. 1170 – c. 1250), also known as Leonardo Pisano, Leonardo Bonacci, Leonardo Fibonacci, or, most commonly, simply Fibonacci, was an Italian mathematician, considered by some "the most talented mathematician of the Middle Ages".[1]
Fibonacci is best known to the modern world for:
(1) The spreading of the Hindu-Arabic numeral system in Europe, primarily through the publication in the early 13th century of his Book of Calculation, the Liber Abaci.
(2) A number sequence named after him known as the Fibonacci numbers, which he did not discover but used as an example in the Liber Abaci.

Long story short, as part of the voodoo of technical analysis there are 3 key numbers:
- 38.2%
- 50.0%
- 61.8%
Look at what happened in the S&P 500 in this selloff from the April peak. The rally in March 2009 began off infamous 666. It peaked at 1220. That is 554 points of gains. 38.2% of 554 = 211. (this is the first retracement) Take 211 points from the 1220 peak and what do you get? 1009.
Where did the market bottom? 1010.
Coincidence or spooky Italian math being propagated by thousands of supercomputers trading at 1/4000th of a second? You decide.
Here it is in chart form, you have to enlarge to see the figures because for some reason stockcharts.com decided it would be cool to make its Fibonacci numbers in light gray.
[click to enlarge]

If one assumes there is more downside to come, the 50% retracement comes in at S&P 943 which coincides nicely with my mid 900s target. The 61.8% retracement would take us to S&P 878 which is a stretch target I am hearing from some of the most bearish folk i.e. mid 800s. Hence, if we begin a new leg down and the ultimate bottom is not the Doug Kass 1010 but instead something within a point or two of one of these other figures I'll have to give mad respect to the Italian math stallion.
Now I don't want to depress you, especially if you are the typical long only account and/or your financial advisor is giving you the same advice as he has since the 2000 top... "buy the dip, every dip!". On the other side of Fibonacci is perhaps a greater force. We call him "Kool Aid man". Kool Aid man's Wikipedia page is as follows.
Kool Aid Man (c. 1970 - current) also known as CNBC inspiration, is a 7 foot, 450 pound mound of pure bull.... err, pure bull excitement, considered by some "the coolest flavored drink mascot in history".
Kool Aid Man is best know to the modern world for:
(1) Spreading stories of nearly permanent good times on financial infotainment TeeVee punctuated by cries of "Oh Yeah!" (loosely translated to "Buy Stock!")
(2) Bursting through brick walls, causing terror amongst small children
(3) Creating moments of humor and joy on Fund My Mutual Fund blog
Always two sides to every trade; let's see who ultimately comes out on top.
© 2024 Benzinga.com. Benzinga does not provide investment advice. All rights reserved.
Comments
Loading...
Benzinga simplifies the market for smarter investing
Trade confidently with insights and alerts from analyst ratings, free reports and breaking news that affects the stocks you care about.
Join Now: Free!
Already a member?Sign in

