
In a previous article, In The Money (ITM), At The Money (ATM) and Out of The Money (OTM) strike prices were discussed in depth. If you need to review that information, click HERE. This article will explain how to use the butterfly strategy on 20-minute binary options, where it is important to understand the difference between where the strike prices are in relation to the underlying market. Another article in this series focuses on using the strangle strategy on 20-minute binary options. To read the strangle article, click HERE. (add link)
Nadex Offers 20-Minute Binary Options
In November 2014, Nadex began offering 20-Minute Binary Options. They are offered during the day between 10:00 a.m. and 4:00 p.m. ET on the four U.S. Indices. The following markets are available for trading:
- Wall Street 30 Based on the E-mini Dow Futures
- US 500 Based on the E-mini S&P 500 Index Futures
- US Tech 100 Based on the E-mini NASDAQ 100 Index Futures
- US Smallcap 2000 Based on the Mini Russell 2000 Index Futures
Being able to trade 20-minute binaries allows you to do some quick trades. When trading 20-Minute binary options, there are two strategies that seem to work well depending on the type of market you are seeing at the time. One strategy is best used in a flat, range bound, non-trending market. The other strategy works well in a choppy volatile market. You have to be able to see a chart and understand what it means.
Charts Help You Place Your Trade
Time based charts plot a line when time passes because the earth has rotated a bit. How is that relevant to your trading? It really does not tell you anything except for very specific cases. Using Diagnostic bars, which plot a line when some market movement has taken place, brings trading to the next level. Diagnostic bars are a cleaner, clearer way to see price action on the chart. If you are trying to trade 20-Minute binaries using one-minute bar charts, you are going to see a lot of choppiness. Five- or ten- minute bars are just too slow to use with 20-Minute binaries.

Expected Ranges
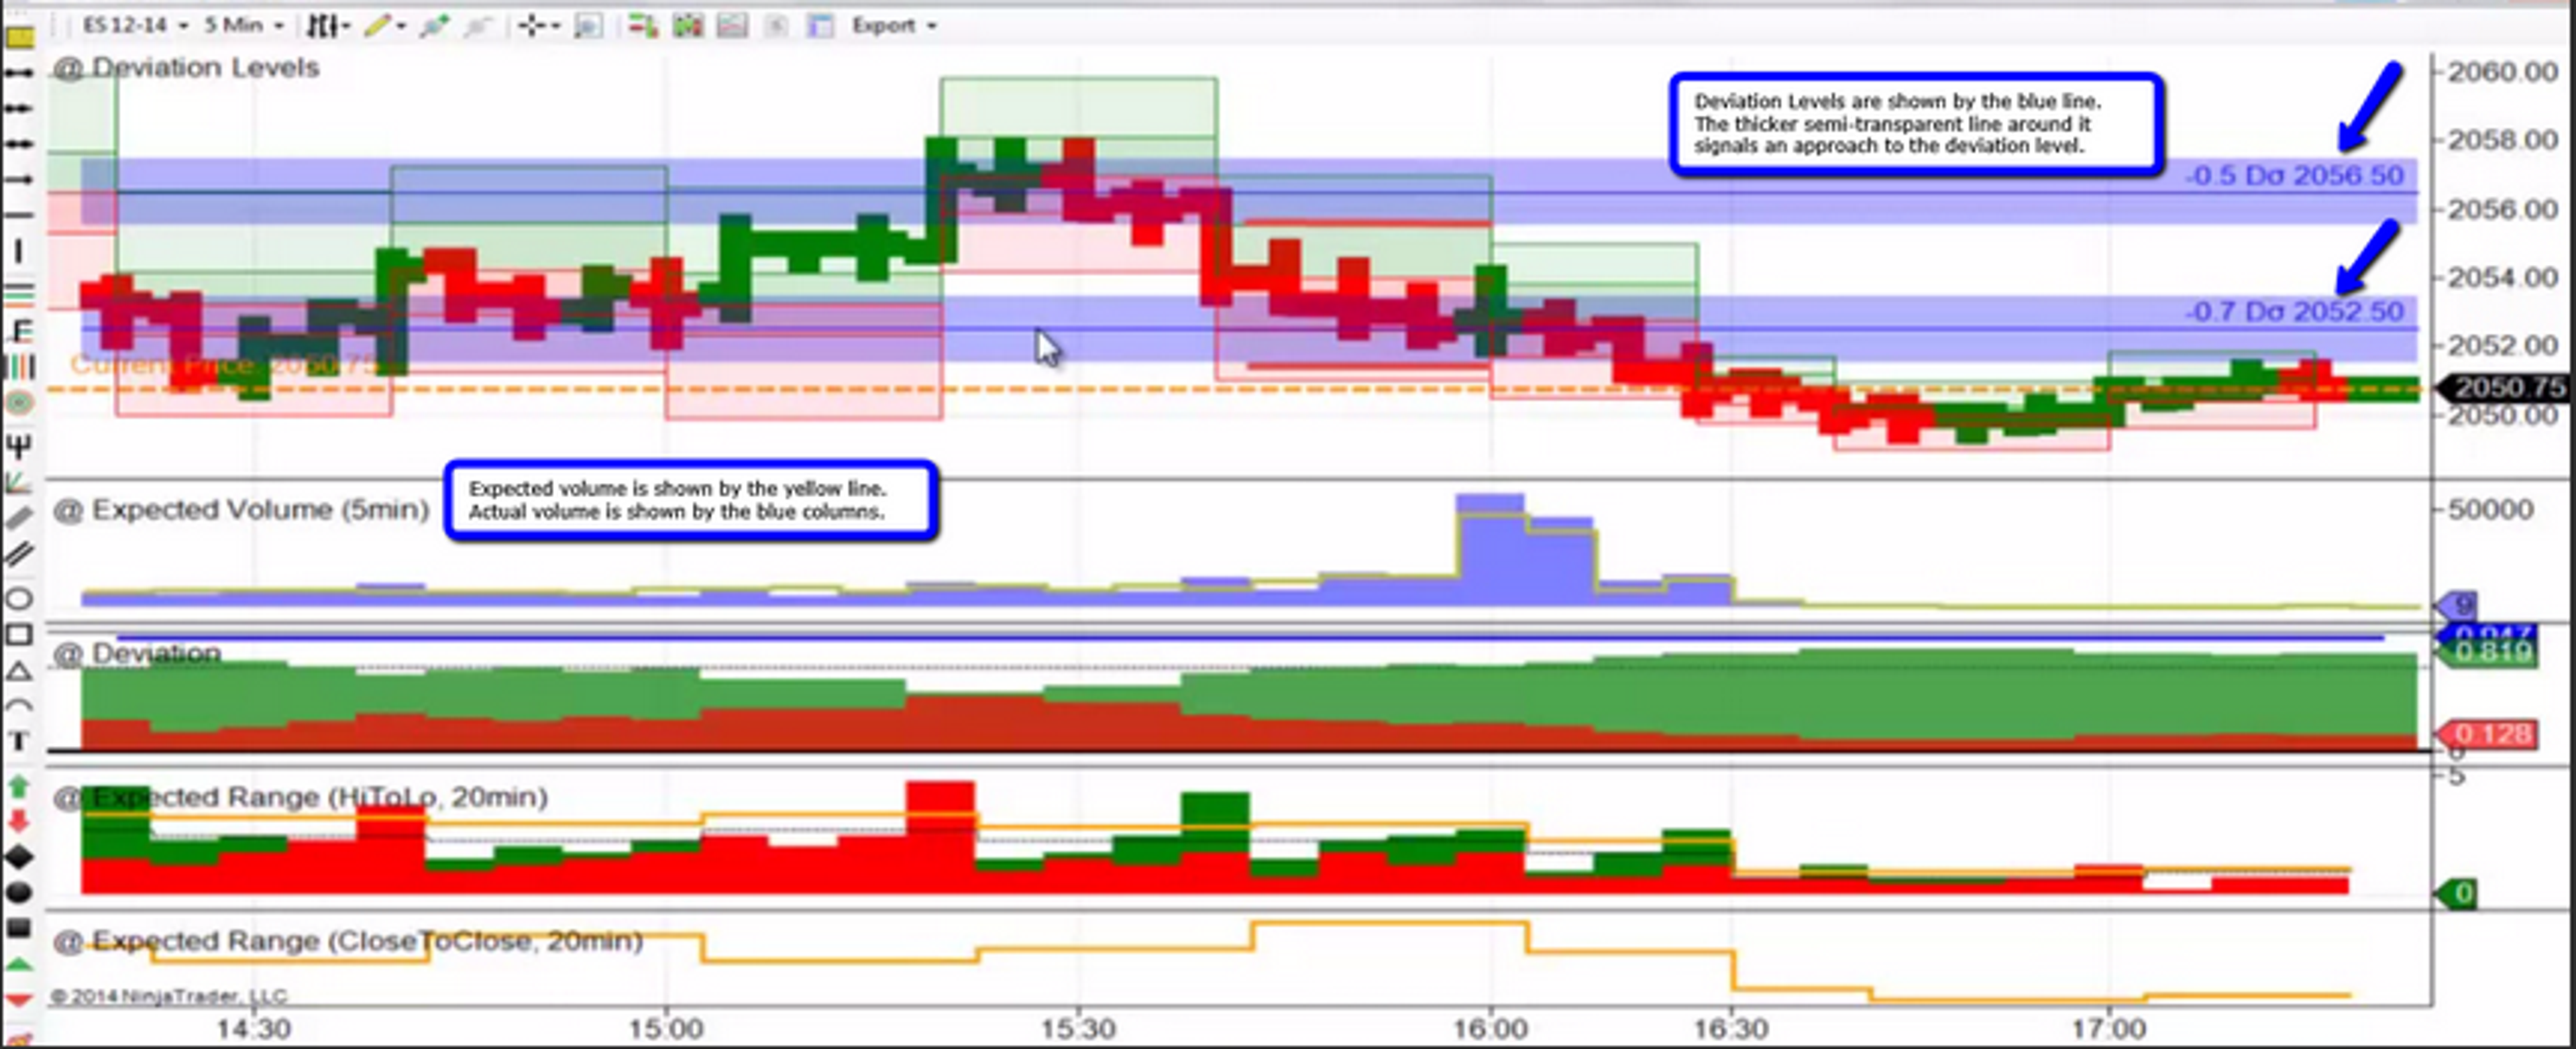
You can see the up and down movement of the chart. Notice the red and green boxed it moves through. Each one of those boxes represents the Expected Range of movement for a 20-minute segment of time. You will notice that not all of the boxes are the same size. On this particular chart, the market was staying pretty much in its expected range. You can use Expected Range to help you set up your trading strategy and that will be explained later.
Expected Volume
The section right under the main chart shows the Expected Volume which is represented by the yellow line. It is set to plot every five minutes. The blue columns show the actual volume. When the blue columns are above the yellow line, you know that volume has exceeded its expected level. If it is below the yellow line that tells you that volume is down.
Deviation Levels
Deviation levels tell you how far a market could move in one day and are based on implied volatility. If the market is approaching a deviation level, it can be a sign of support or resistance and something for you to take into consideration as you plan your trade. The lines are plotted right on the main chart. They show what level it is, either up or down and the corresponding price. In the chart above you can see both the -0.5 and -0.7 deviation levels at 2056.50 and 2052.50 respectively. The semi-transparent area around the deviation line lets you know that if the market is in that area it is approaching a deviation line. That can be your signal that there may be a change in the direction of the market.
News
One more thing that you cannot plot on your charts but you have to be aware of is the news. What? You may say. You might not trade the news, but the news has a way of affecting the markets, which then can affect what you are trading. You may be watching a market and think that it is flat, so you put on a butterfly and BAM! The market flies up, then down and you have suddenly lost on both sides of your trade. Your strike was hit on both sides limiting your losses, but you were still kicked out of the trade. You did not know that today was a US FOMC (Federal Open Market Committee) and Feds Funds Rate News Release Day! Check the news before you start your trading day.
Flat Market? Quit For The Day? No Way!
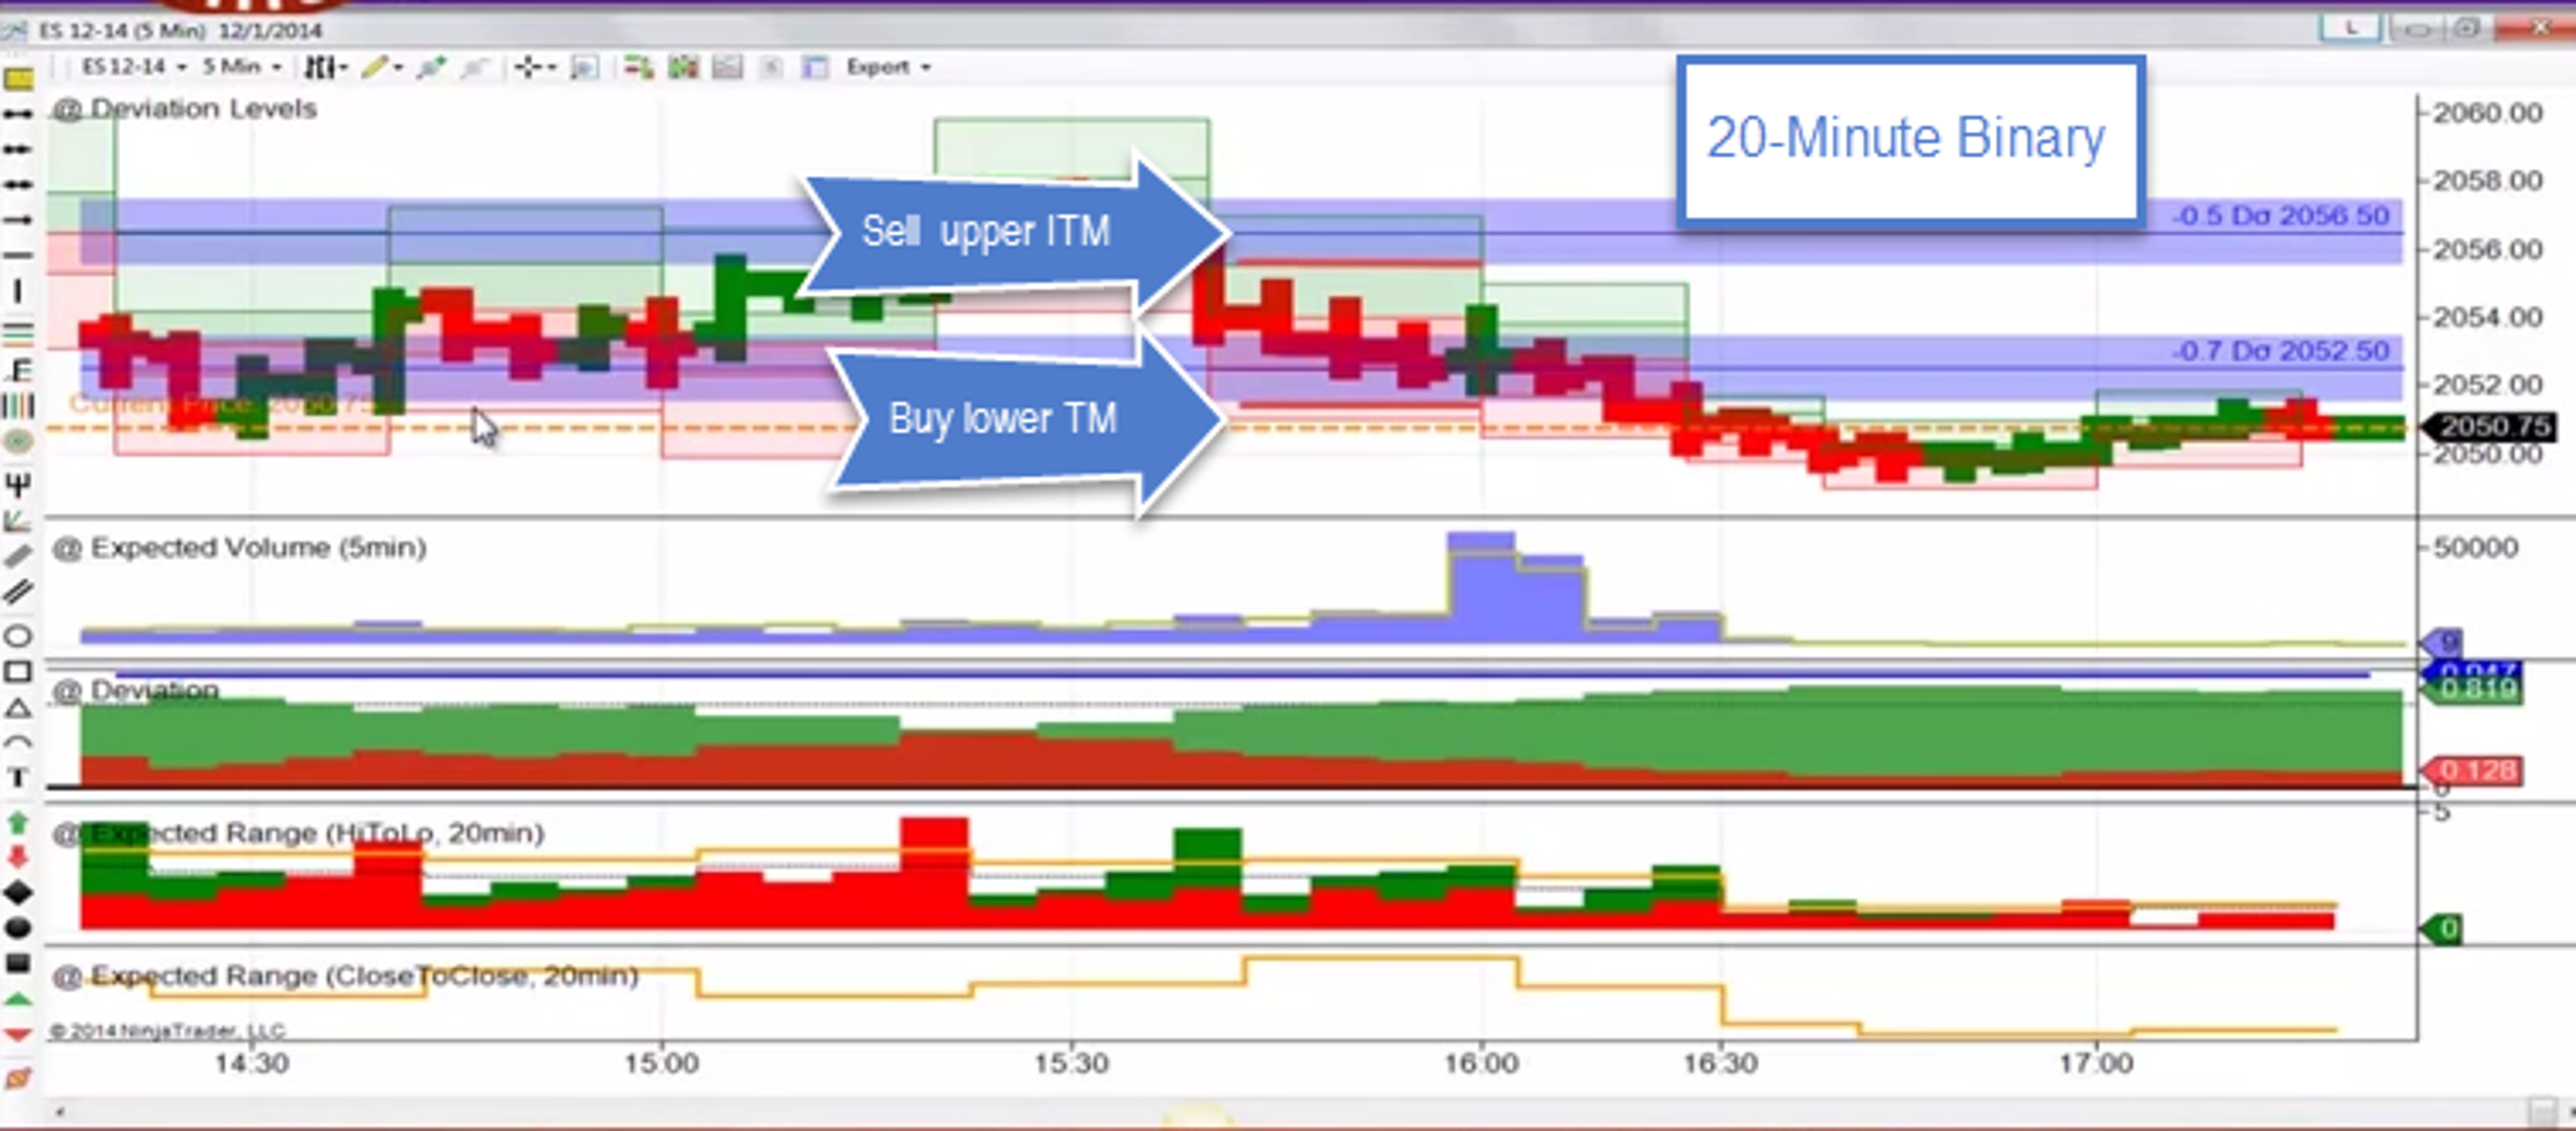
If it is a relatively quiet day and you are not seeing a lot of movement in the market, you may think there is not a thing you can do except quit trading and find something better to do. After all, who wants to sit in front of a computer screen and feel like they are watching paint dry? Well, even when it’s a flat market or a non-trending market, there is a strategy that doesn’t require much movement. It’s known as the butterfly and it is the perfect strategy to use on range bound 20-Minute Binary Options.
How To Do A Butterfly
A butterfly strategy is when you want to surround the flat market by selling an upper ITM binary and at the same time, buy a lower ITM binary. The object is to have the market expire anywhere in the middle between the bought and sold strike prices. You are saying that the market is going to stay between your bought and sold strike prices. Looking at the chart below, you will see that the market is not exceeding its expected ranges. It is staying between 2051.00 and 2056.75.

For this example, let’s say you were able to buy one >2051.05 contract for 82.5 and sell one >2055.05 contract for 19.5, both with 4:00 p.m. expiration times. This is saying that you expect the market to settle somewhere between 2051.05 and 2055.05 at 4:00 p.m. As long as that is the case, you will be profitable on both sides.

The image above shows how much the P&L (Profit and Loss) on this trade had accumulated when the screenshot was taken. You can always exit before expiration to protect your profits. However, your profit potential, if held until expiration would be $17.50 on the buy side and $19.50 on the sell side for a total of $37. Fees at Nadex would take $3.60 from the total leaving you with $33.40 for a trade taking less than 20 minutes.
If you are able to do this strategy repeatedly, you have the possibility of making more money. You can also increase the amount of contracts you do on each trade, making sure that you have an equal number of buys and sells for each trade.
What if one side moves against you? Twenty-Minute Binaries can move fast, but you can have your stop loss set to manage your risk and avoid a full loss on one side. If the buy side had lost in the above example, the sell side would still be profitable and excluding fees, you would come out slightly profitable. Your total max risk on a butterfly is $70 as one or the other or both can expire ITM.
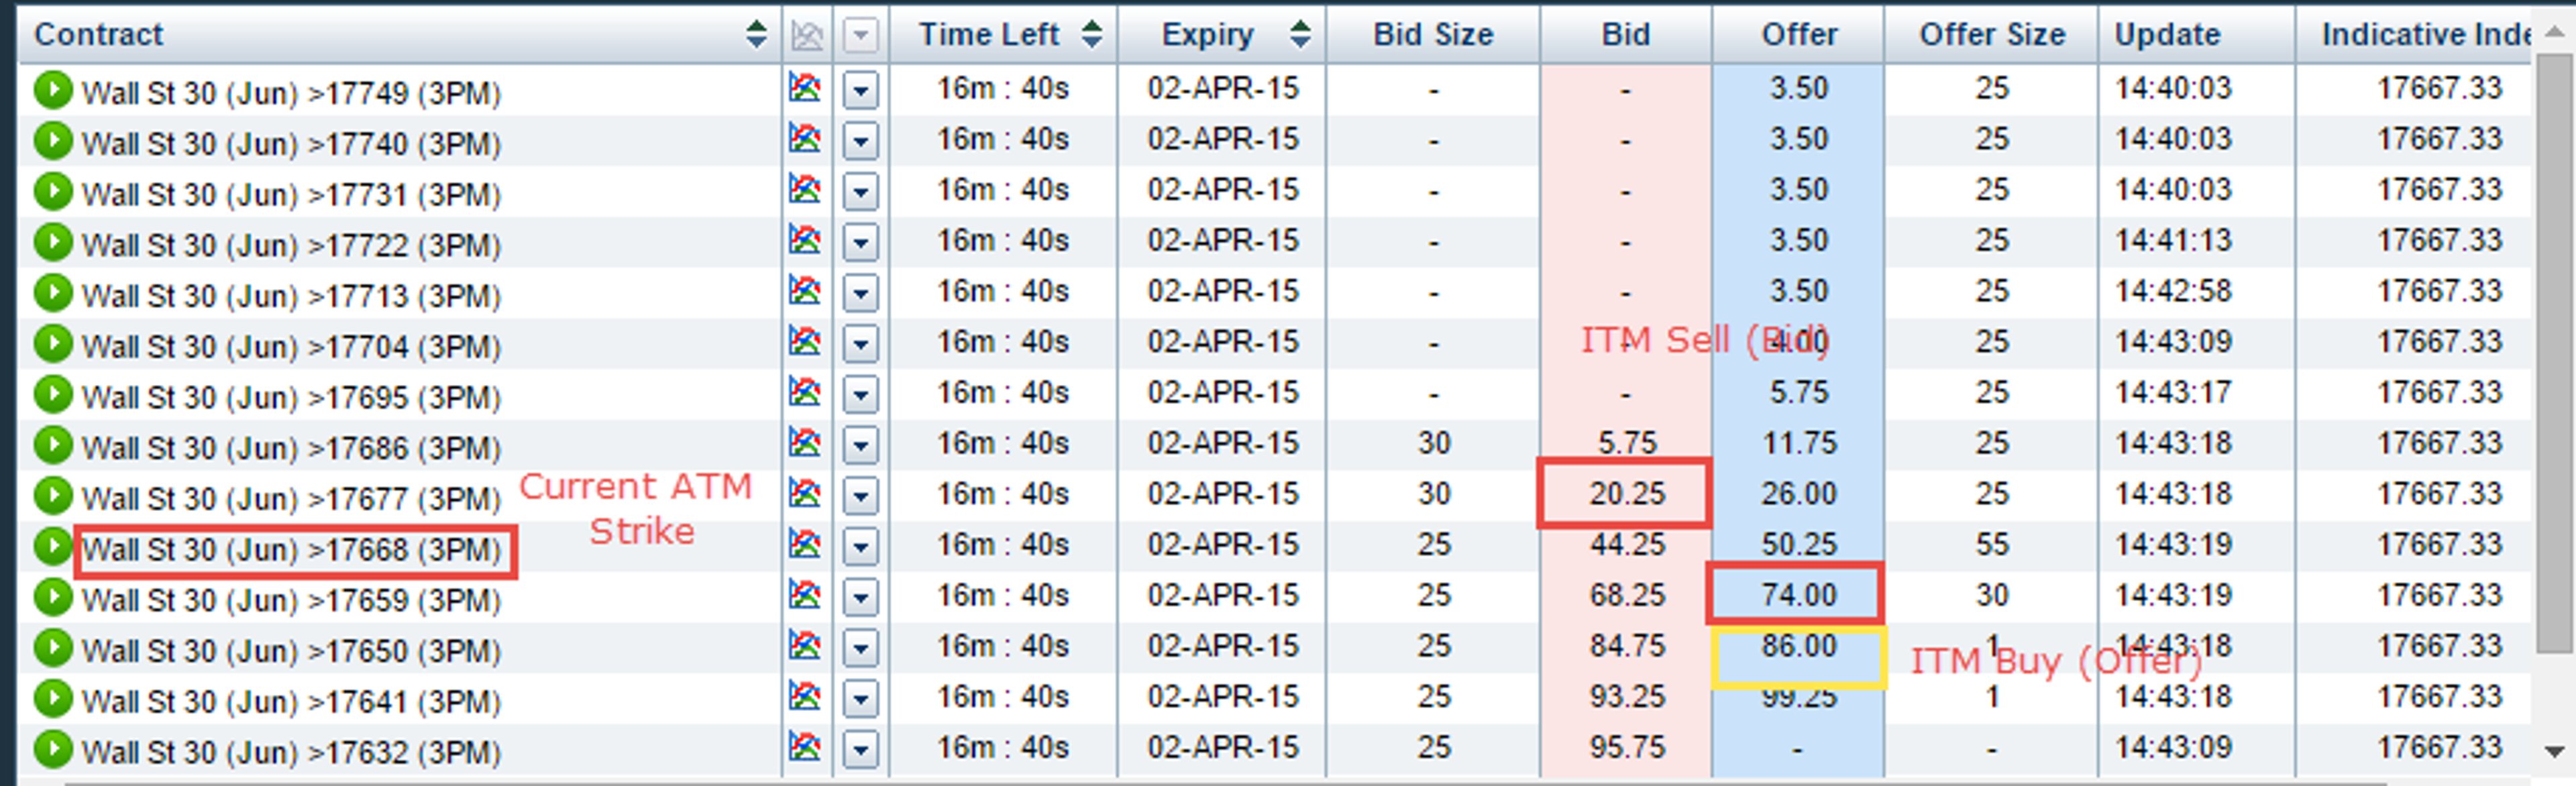
Let’s look at it one other way. If you are placing your trade on Nadex, you will first want to see the market you are trading, find the current ATM strike price and then determine if there are any buy and sell strike prices that fit your criteria for placing your butterfly trade. The minimum profit you want when using the butterfly strategy is $25. Use a stop loss to limit risk and exit both sides at the same time.
Things To Remember When Placing A Butterfly Trade
- Market is Range Bound or Flat
- Market is Non-Trending
- Use only ITM Strikes
- Consult the Expected Ranges. Make sure market is not exceeding them.
- Verify lower than expected volume
- Check Deviation Levels
- Know about upcoming News that may affect your trades
- Buy a Lower ITM Strike
- Sell an Upper ITM Strike
- Make sure they have the same expiration times
- Place the trades simultaneously
- Set Stop Loss
- Understand Risk/Reward
- Have a Reason for placing the trade
To learn more about other trading strategies, go to www.apexinvesting.com, a service of Darrell Martin.
© 2025 Benzinga.com. Benzinga does not provide investment advice. All rights reserved.
Trade confidently with insights and alerts from analyst ratings, free reports and breaking news that affects the stocks you care about.

