


12/20/2015: update to PCLN.
one can see that this has been an amazing rocket ship.
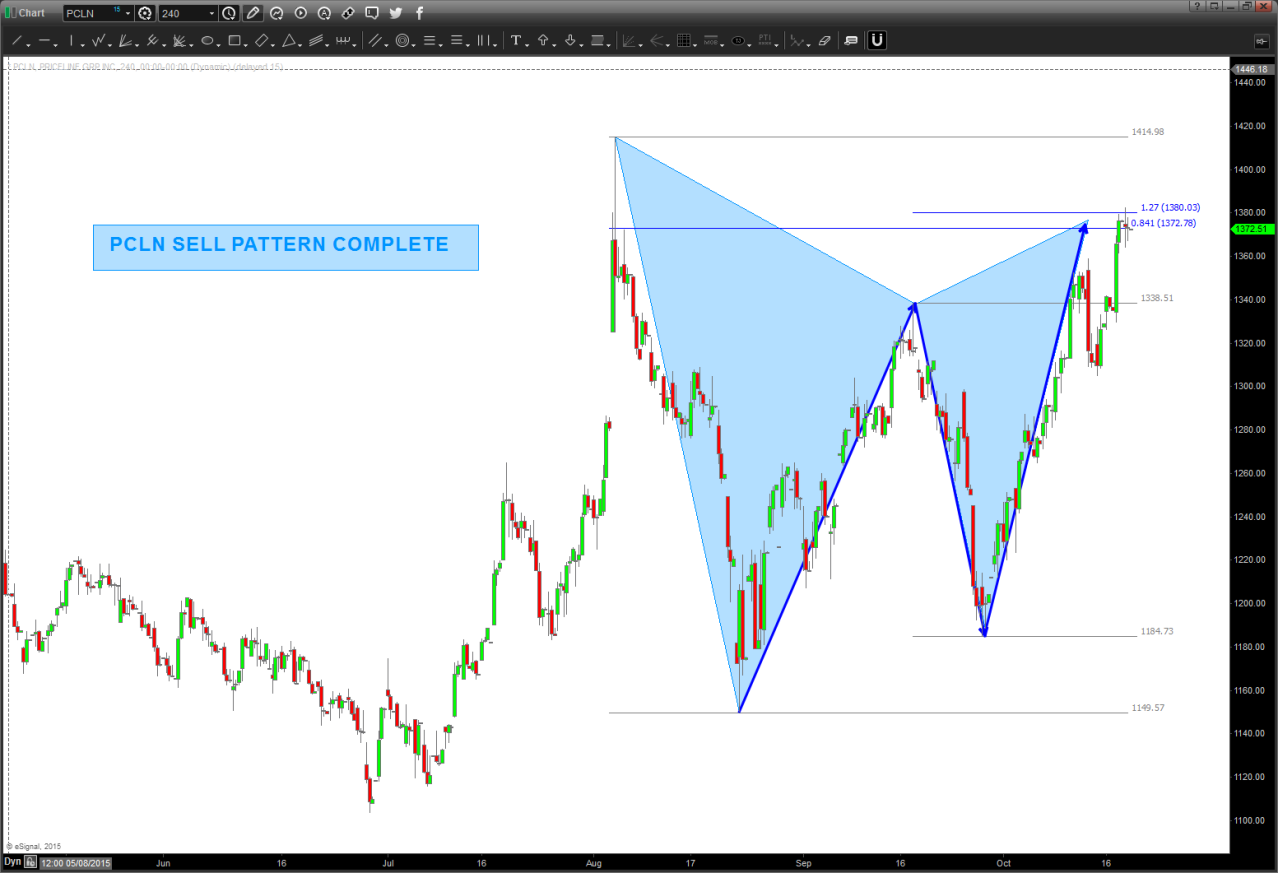
one can also see below that I was “seeing” a top coming in and tried the mirror image foldback, which from a price perspective DID NOT work. then, you can see that I was “seeing” a butterfly pattern and that missed the target area by a few bucks.
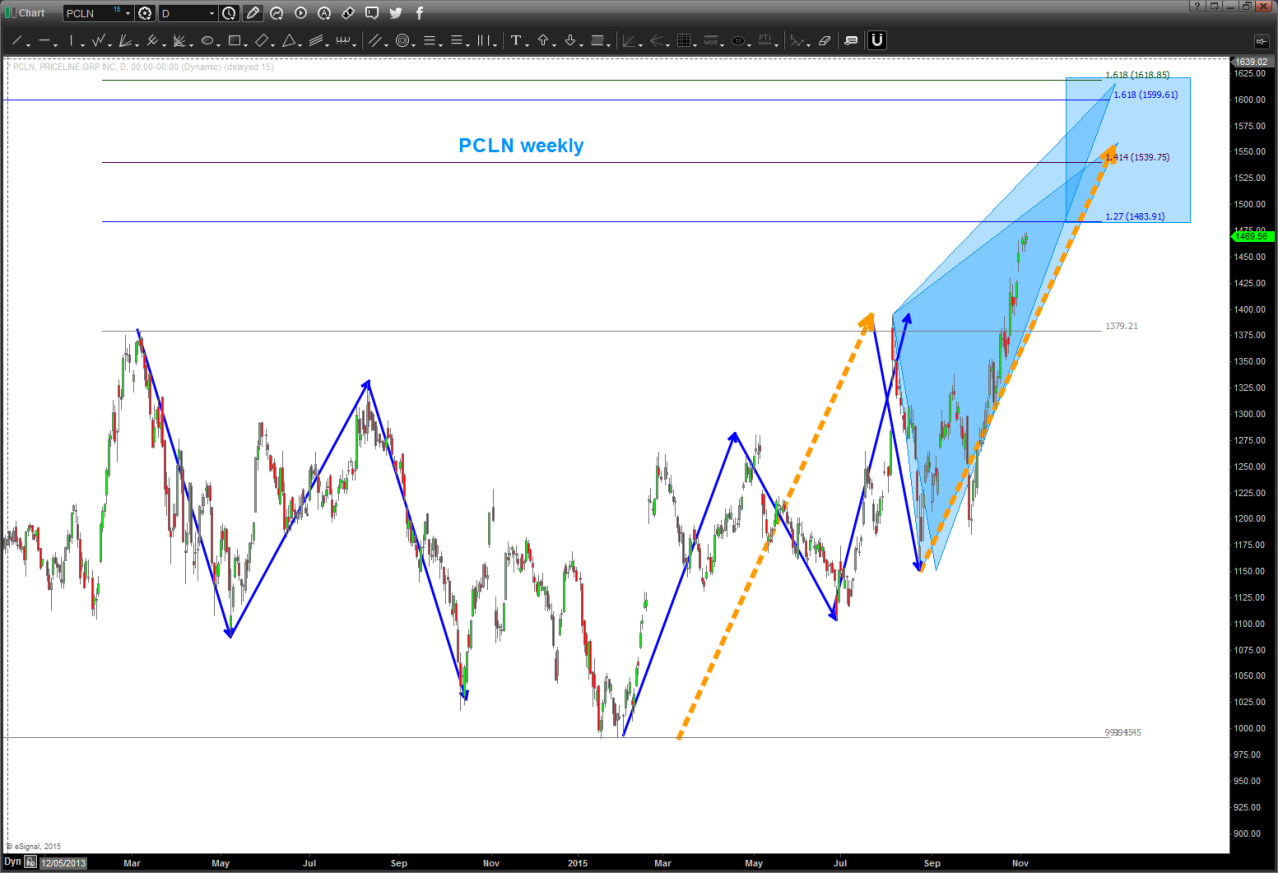
so, in summary, let’s watch the key low to high trend line shown in the chart below. also note the TIME symmetry around the foldback points. I missed that below, but that actually lends some credence to a potential big top.
this one has been tough .. but, then again, when you go from 3 dollars to 1450+ it’s going to take some time to digest.
anyway, for those who asked me, hope this helps w/ the gameplan for $PCLN.

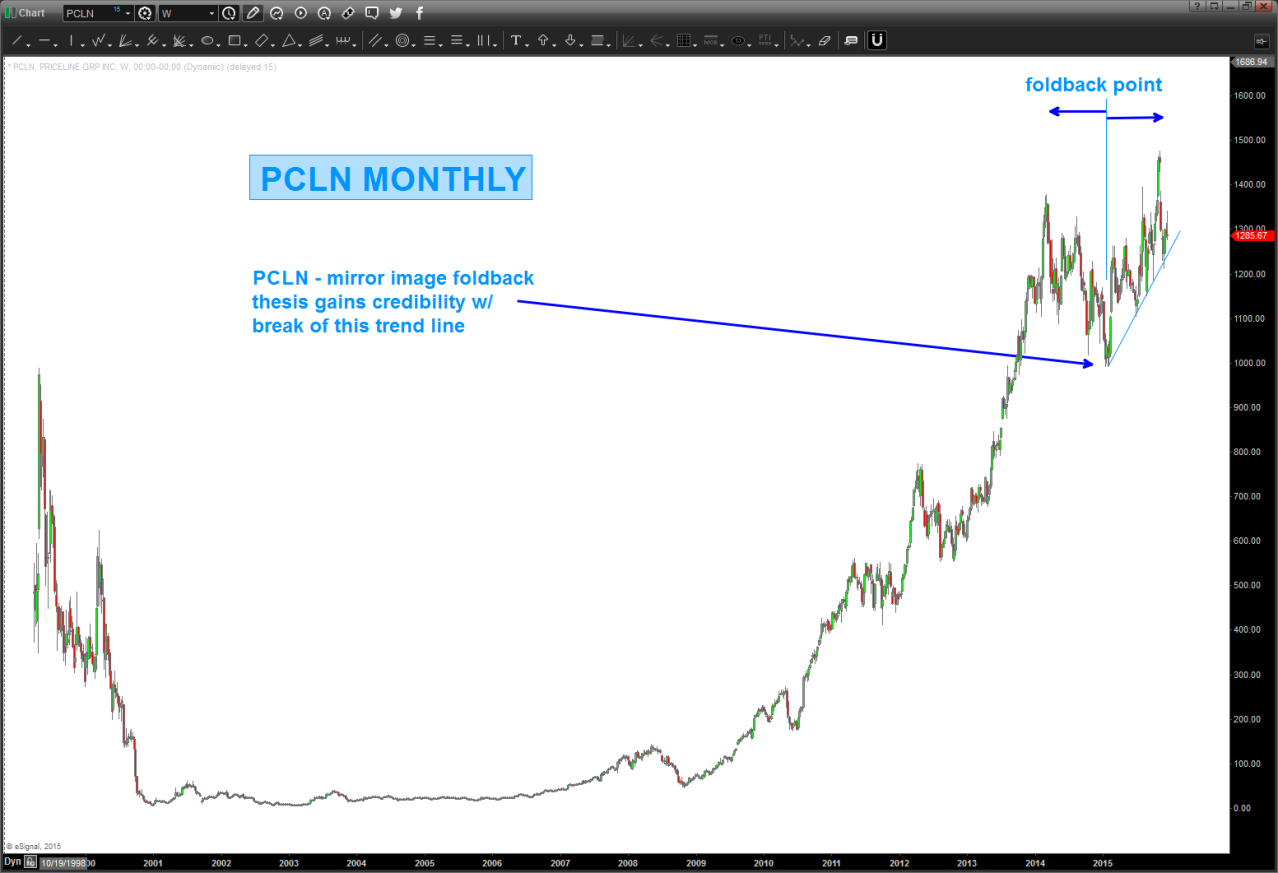
Folks, this mirror image got smoked. Much like the mirror image for Natural Gas … the mirror images fail at the inflection points and $PCLN has rolled thru the pattern. ERASE … ERASE…ERASE.
Where are we now?
Well, if we look at the candles you’ll see the 2nd largest monthly candle since the IPO occurred last month (OCT) So, we have 1484 coming in but it sure looks like momentum and thrust will carry it to the 1600 level. I’m going to spend some time on this one over the next couple days …
here’s the MONTHLY picture …
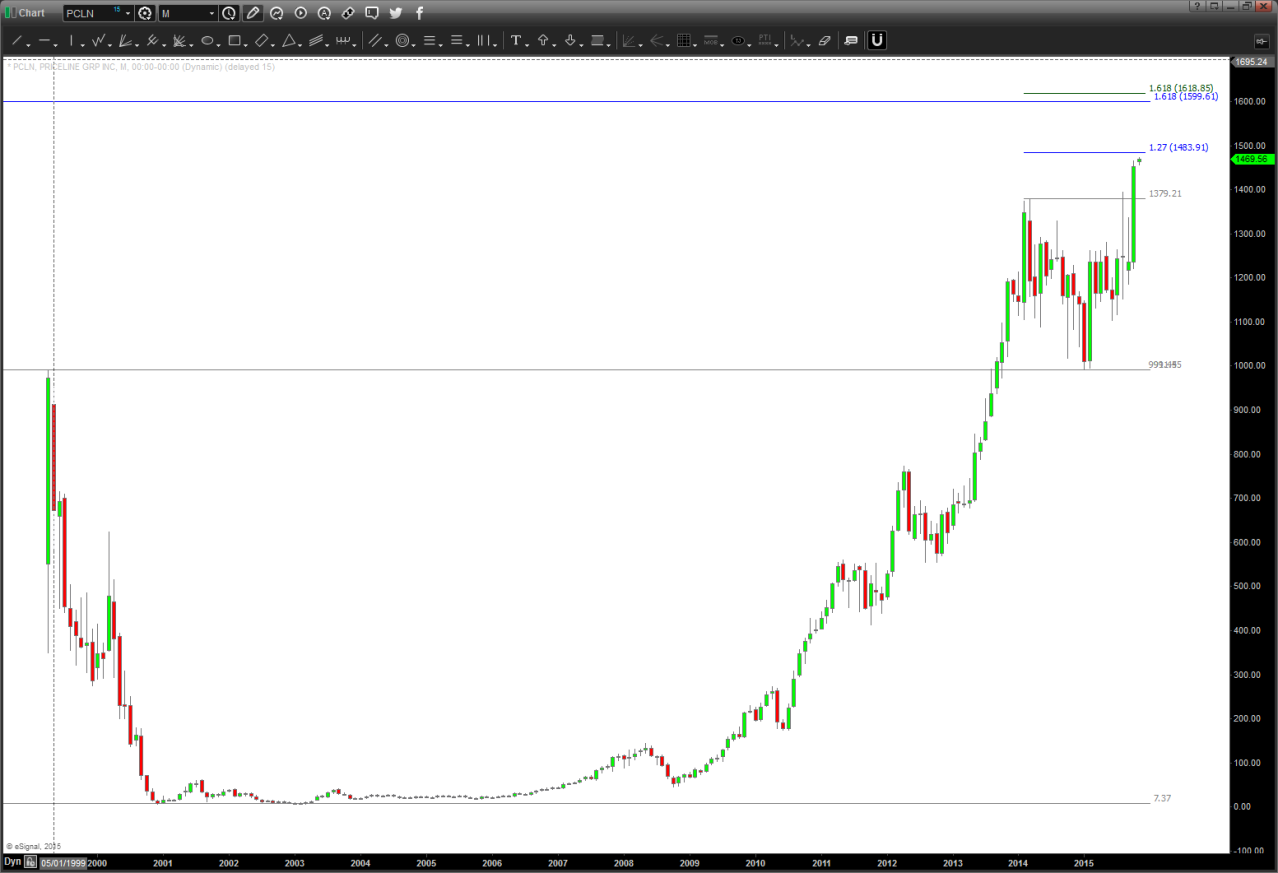
IF the mirror image foldback is in play THEN this pattern needs to hold and start down. a move below 1360 would bolster conviction that the mirror image mentioned earlier is in play.
This was originally shared at Bart's Charts
Edge Rankings
Price Trend
© 2025 Benzinga.com. Benzinga does not provide investment advice. All rights reserved.
Trade confidently with insights and alerts from analyst ratings, free reports and breaking news that affects the stocks you care about.

