


Sometimes it can be advantageous to step back from the blinking screens and the wild intraday swings in order to try and get a feel for the bigger picture.
On that note, there can be little argument that the U.S. stock market has undergone a corrective phase since what is now referred to as the "Alibaba top" BABA seen on September 19. The question now, of course, is if the correction is over or if the bears are just resting while the bulls put in a few frenetic days of upside action.
Corrections Are Part Of The Game
From a big-picture standpoint, it is important to remember that corrections in the stock market are part of the game. While pullbacks have been short and sweet over the past couple of years, historically, the market has seen at least one correction of -10 percent or more each year. History also shows that each year usually experiences a handful of pullbacks in the 5 percent range.
However, it has now been 745 trading days (or almost three full years) since the last pullback of -10 percent or more on the S&P 500. It is worth noting that this is the second longest streak without a -10 percent pullback since 2000 and the third longest period of time without a meaningful correction in history.
For starters this morning, here's a tip: If the recent action put fear in your heart, then it is probably a good idea to "sell to the sleeping point" and to use the current rebound to lighten up a bit. The bottom line is that if a pullback of 5 to 6 percent is causing you consternation, then you are overexposed to risk.
Although the market has been rebounding in furious fashion since the central bankers started talking it up by suggesting that more QE could be on the way if things get nasty, the question is if the current corrective phase will morph into the big, bad decline that so many analysts have been looking/calling for.
The trend for the past three years has been for all dips to be bought and for all declines to end in a "V" fashion. As such, a great many traders probably expect the market to continue blasting higher. After all, the S&P is already up more than +4.5 percent in the last four days on an intraday basis and +2.2 percent on a closing basis. It is clear that the rebound is "on" and that it will be up, up and away from here, right?
A Few Things Are Different This Time
However, there are a few things happening currently that were not in place during all the little pullbacks seen since 2011.
First, this time around, there is no "crisis" for traders to breathlessly follow each and every day. No, this time, the worries are based on fundamentals such as global economic growth and inflation/deflation.
Next up, there is the combination of technical divergences and narrow leadership. While this situation could easily rectify itself with a few more days of frenzied upside action, this dynamic duo has a nasty habit of showing up during important market tops.
Finally, it is worth noting that some longer-term indicators are starting to wave red flags, which is an indication that all is not well beneath the surface. Again, if the bulls have indeed rediscovered their mojo thanks in part to the words of the world's central bankers as well as Apple's AAPL gangbusters earnings report, then all of these pesky little technical issues could easily fall by the wayside.
Speaking Of Bounces
Assuming the rally that is occurring in the premarket holds up (S&P futures are up about 15 points as of this writing), there will likely be an awful lot of talk about the S&P recapturing its 200-day moving average. The press will trot out that idea that this means all is now right with the world again and that the bulls are back in business.
Of course, time will tell on that score, but one good way to measure how far a rally within a corrective phase can go is to look at Fibonacci retracement levels.
S&P 500 SPY - Daily

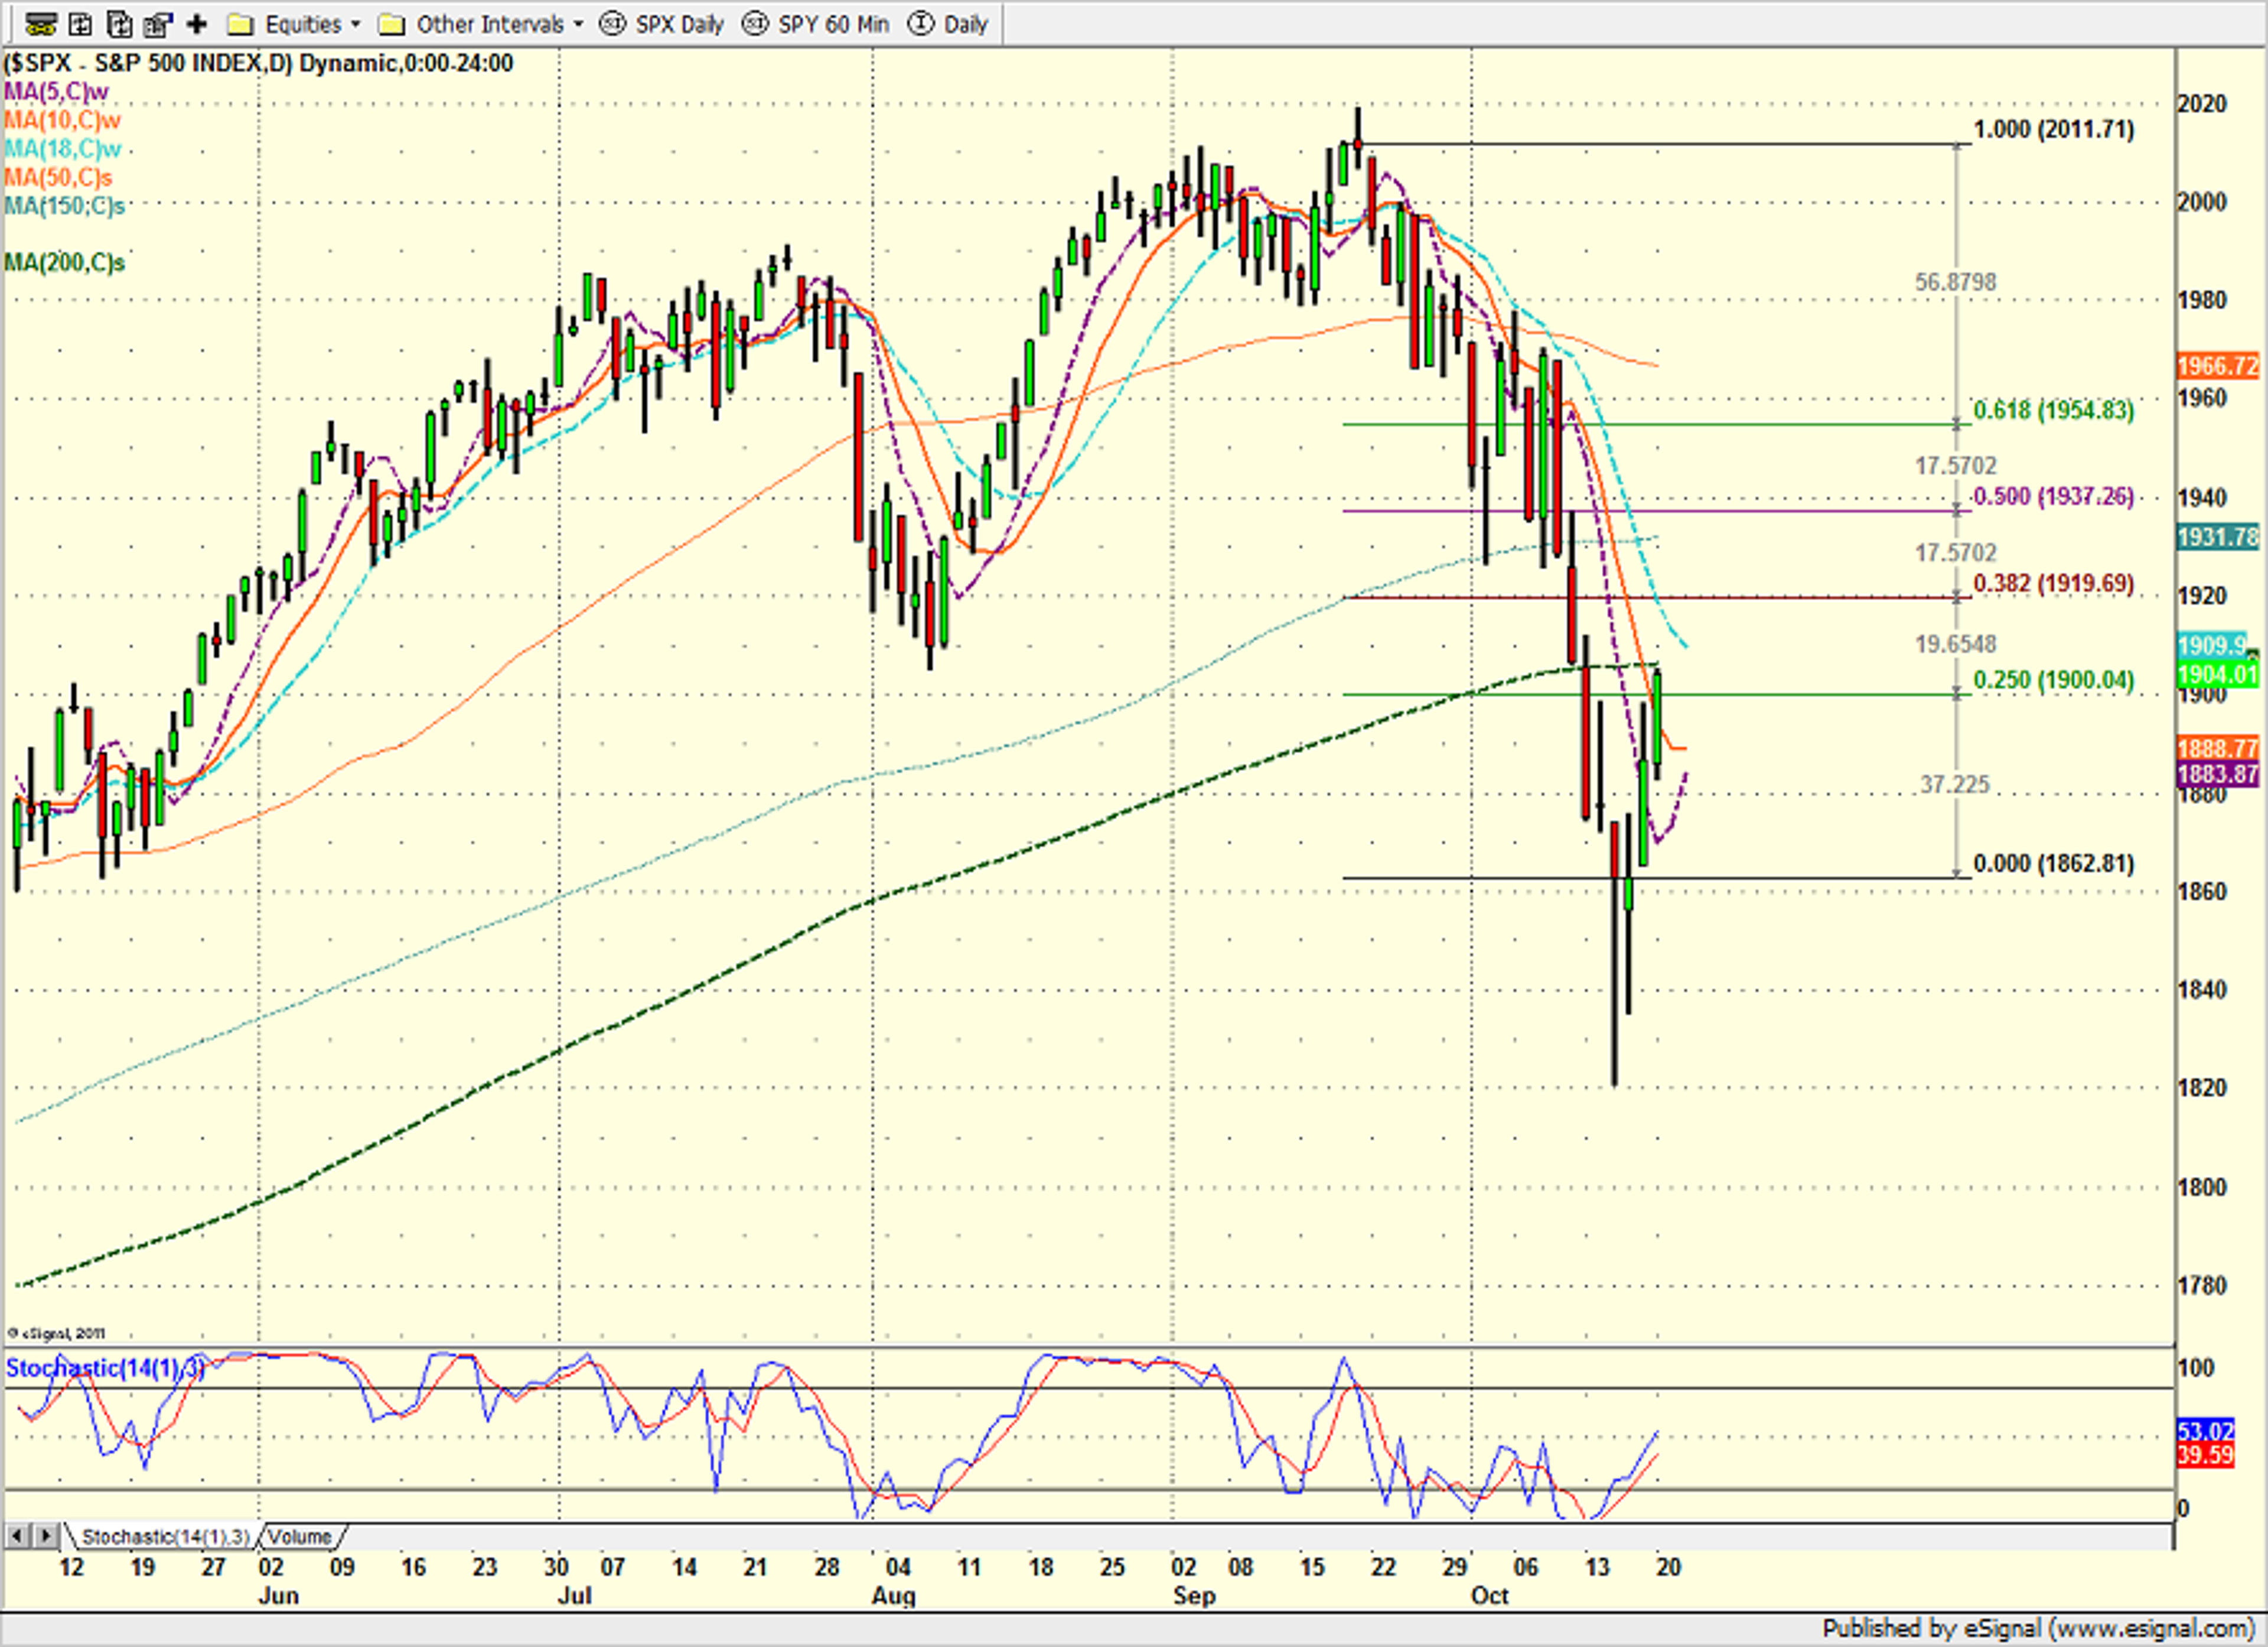
The chart above shows the Fibonacci retracement levels on a closing basis. The first key level -- the 25 percent retracement level -- was satisfied with yesterday's pop higher.
Therefore, the next important level to look for is the 0.382 retracement, which currently resides at about 1,920. Since this also happens to be an important retracement level on an intraday basis, it is a safe bet that this level should get some attention in the near-term.
After that, it looks like 1,937 and 1,954 are key levels to watch.
Time To Buy the Dip?
Another big-picture item to keep in mind is that this likely remains a secular bull market. As a quick reminder, a secular cycle tends to last around a decade or more. The chart below shows the secular cycles over the last 25 years.
S&P 500 - Daily

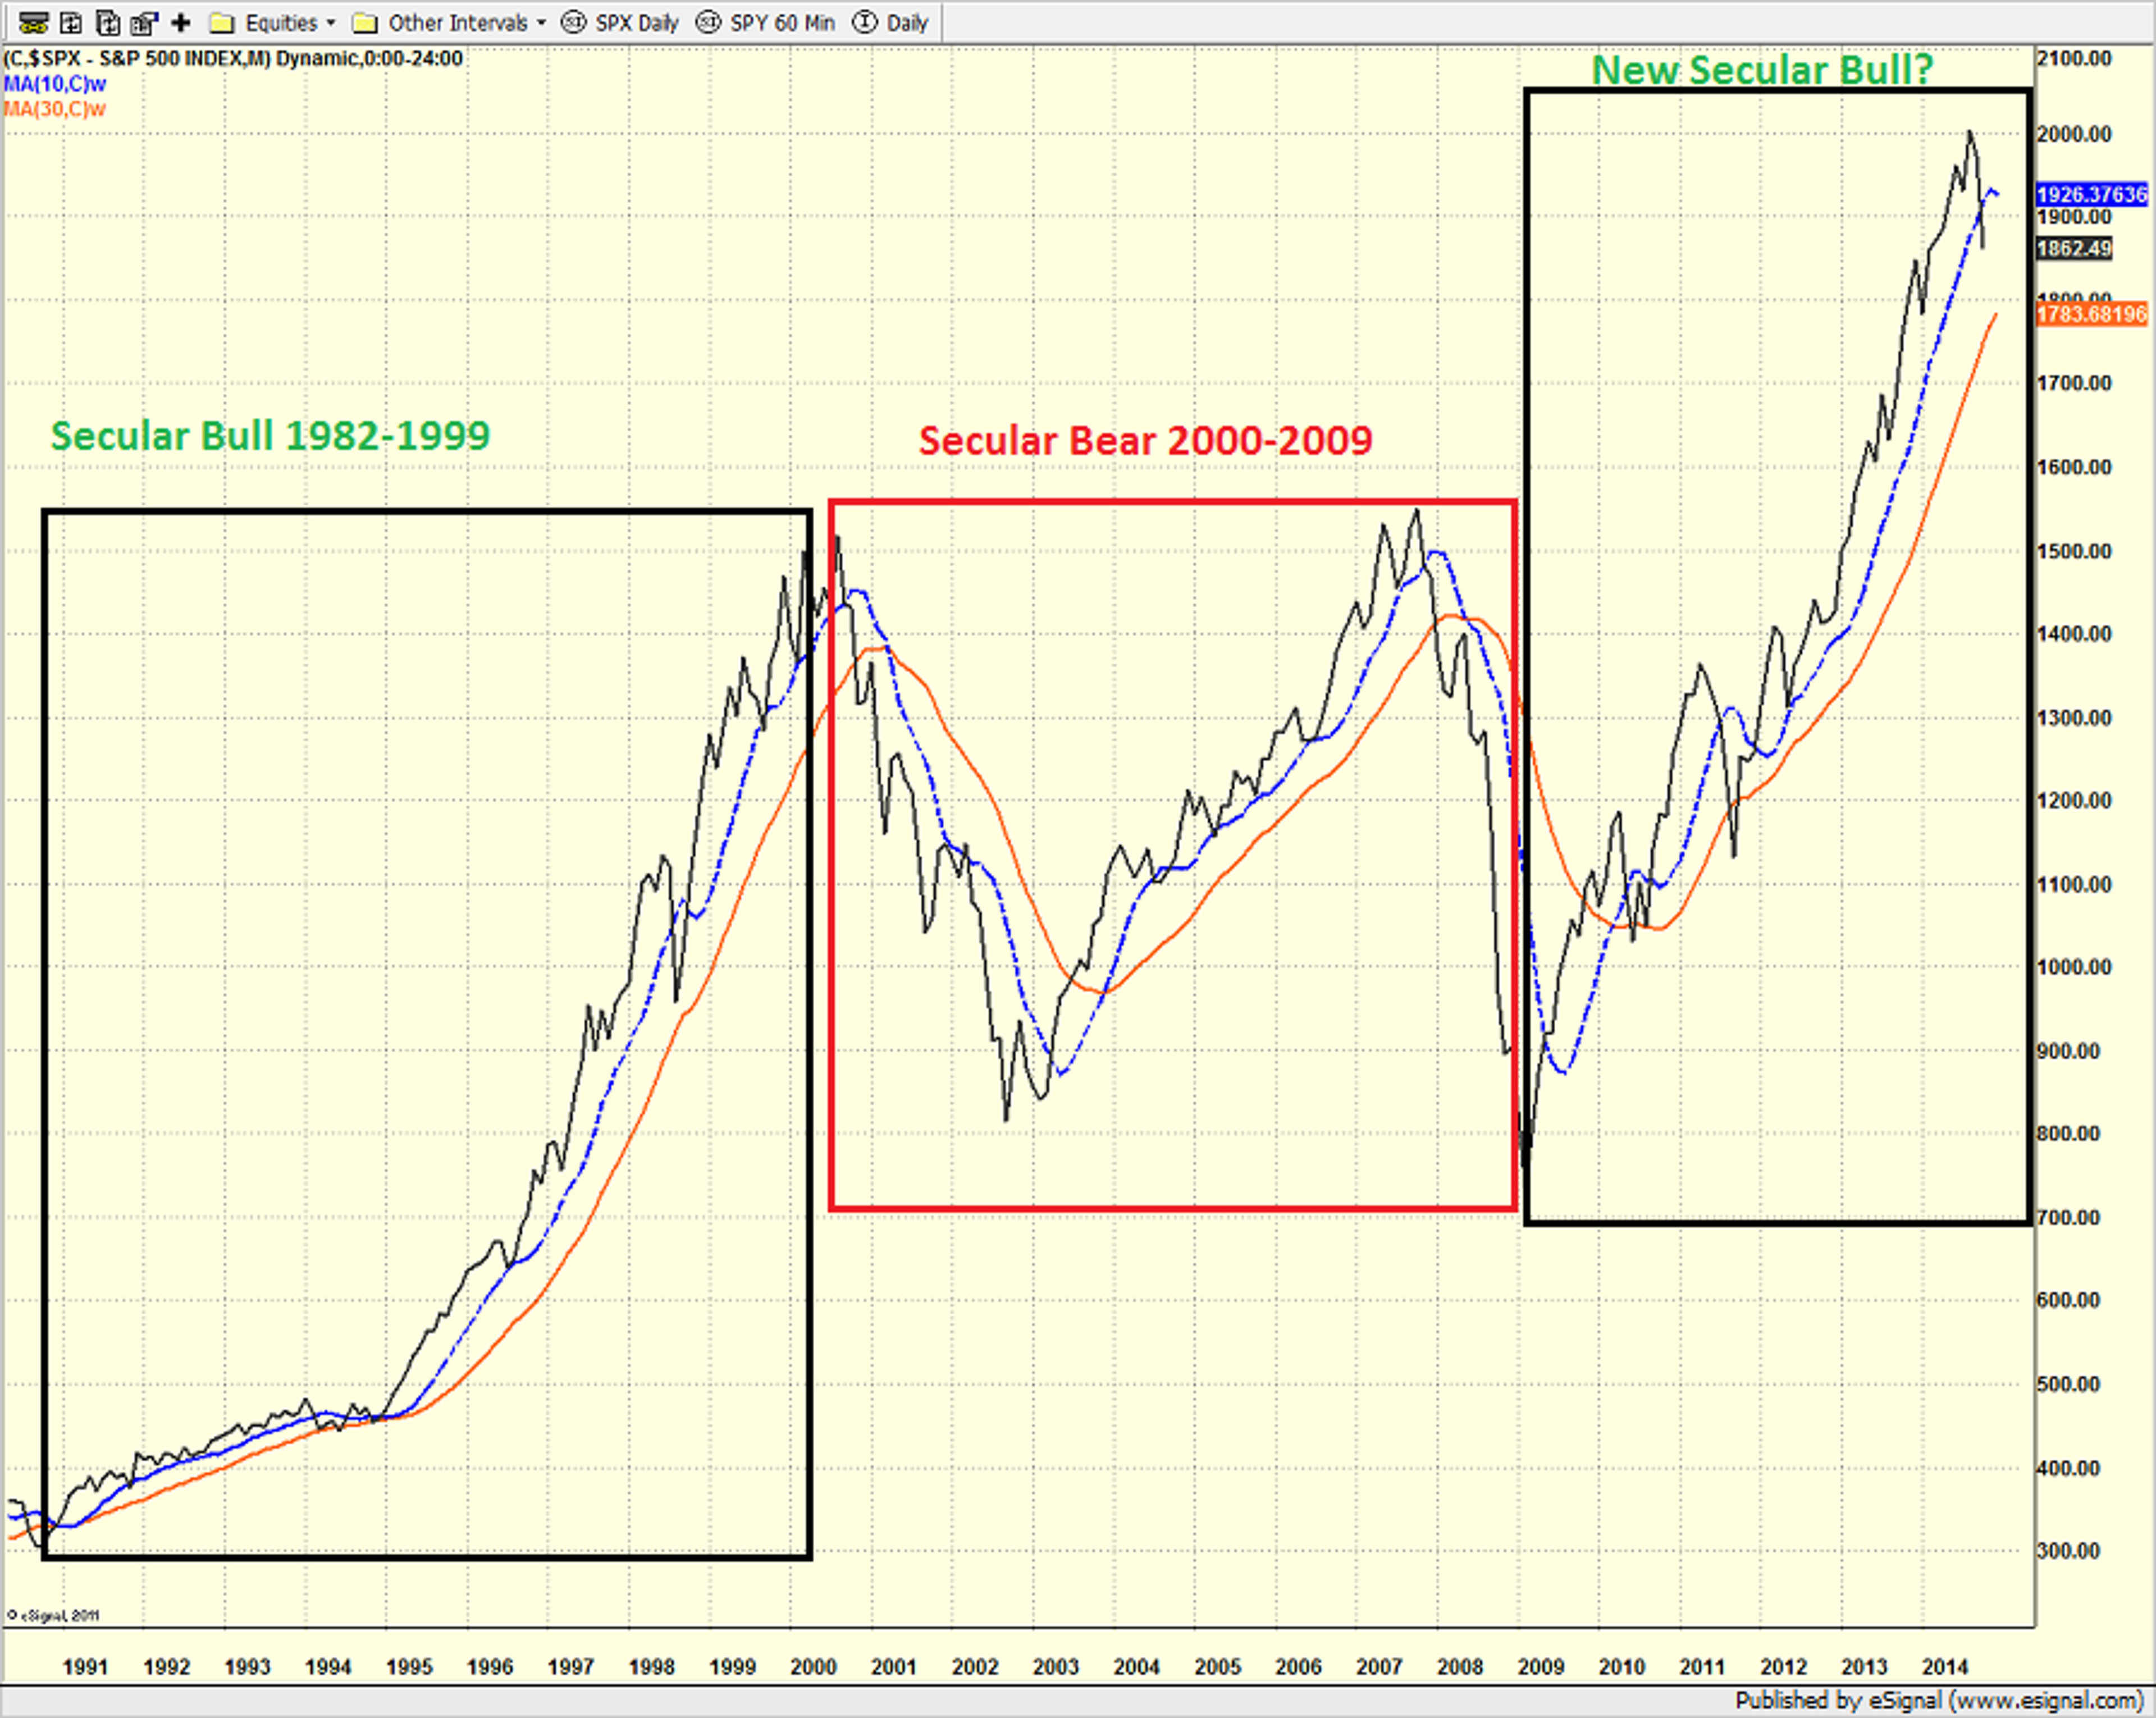
Why bring up something so long-term in nature when the day-to-day market condition remains in flux? Because history shows that meaningful corrections occurring within the context of a secular bull market tend to be strong buying opportunities.
Then there is the fact that markets are entering the best seasonal time of the year. Remember, all of the stock market's gains over the past 115 years have occurred during the November through April period.
So, for those long-term investors with cash on the sidelines, it is probably time to start doing some dip-buying. Heaven only knows if the corrective phase is over. It is certainly a good idea not to put all of your cash to work at once as the fundamental worries could easily return after the bulls enjoy a spirited bounce. The key here is that putting money to work when things get tense has been a very good strategy for a very long time.
Edge Rankings
Price Trend
© 2025 Benzinga.com. Benzinga does not provide investment advice. All rights reserved.
Trade confidently with insights and alerts from analyst ratings, free reports and breaking news that affects the stocks you care about.

