27% profit every 20 days?
This is what Nic Chahine averages with his option buys. Not selling covered calls or spreads… BUYING options. Most traders don’t even have a winning percentage of 27% buying options. He has an 83% win rate. Here’s how he does it.
By Moe Zulfiqar
We have now entered into September, one of the most volatile weeks for the key stock indices in the U.S.economy. With this, there are questions as to where these key stock indices are going next. The bulls and the bears are at it again, adding to the noise already present.
ENTER TO WIN $500 IN STOCK OR CRYPTO
Enter your email and you'll also get Benzinga's ultimate morning update AND a free $30 gift card and more!
In the first eight months of the year, key stock indices like the S&P 500 have gone up by 14.49%. (Source: Stockcharts.com, “Historical Price Data,” StockCharts.com last accessed September 5, 2013.) Other key stock indices like the Dow Jones Industrial Average and the NASDAQ Composite are in a very similar situation. Looking at all these gains, one must ask: will this trend on key stock indices continue?
Looking at some historical returns of the S&P 500, since 1970, the index has provided investorsan average return of 8.2% per year.
Now, if we take the yearly return of the S&P 500 as a benchmark and consider it an indicator of relative value, then the index is overvalued by roughly 76.7%.
Just looking at this value alone, investors shouldn’t just jump to conclusions and start positioning their portfolio for a sell-off ahead while waiting for key stock indices to “come back to their average.” As a matter of fact, in 24 out of 43 years, from 1970 to 2012, the S&P 500 yearly return has been above average, sitting above the threshold of 8.2%
Here’s what investors really need.
FREE REPORT: How To Learn Options Trading Fast
In this special report, you will learn the four best strategies for trading options, how to stay safe as a complete beginner, a 411% trade case study, PLUS how to access two new potential winning options trades starting today.Claim Your Free Report Here.
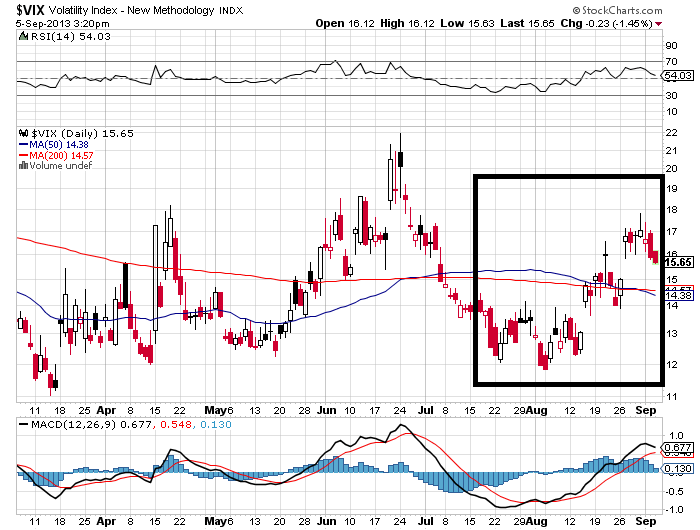
There seems to be fear kicking in. Please look at the chart below of the Chicago Board Options Exchange Market Volatility Index (VIX), also referred to as the “fear index,” and pay close attention to the squared area.
Chart courtesy of www.StockCharts.com
The fear index has been increasing since the beginning of August. It surpassed its 50-day and 200-day moving averages mid-month, and currently stays above—fear is creeping in slowly.
Furthermore, the U.S. government is reaching towards its debt limit, which it is expected to hit by October. This was stated in a letter to Congress from Jacob “Jack” Lew, secretary of the Treasury. (Source: “Debt Limit,” U.S. Department of the Treasury web site, August 26, 2013.) Back in 2011, when the U.S. government hit its debt limit, we saw key stock indices become volatile because of uncertainty—the same phenomenon might now occur once again.
As we move forward, investors should monitor the market conditions closely. From the VIX, we see volatility or fear coming into the markets, and it might continue to do so. At the end of the day, it all depends on how an investor is able to align their portfolio. They should remember to keep their risks in check, playing conservative when risks are increasing.
Keep in mind that exact tops and bottoms on key stock indices are very difficult, if not impossible, to predict. Investors shouldn’t just jump to conclusions and make irrational decisions about their portfolio.
This article What You Really Need to Know About September’s Market Volatility was originally published at Daily Gains Letter
27% profit every 20 days?
This is what Nic Chahine averages with his option buys. Not selling covered calls or spreads… BUYING options. Most traders don’t even have a winning percentage of 27% buying options. He has an 83% win rate. Here’s how he does it.