Crypto Whales Are Loading Up — Are You?
New research shows the biggest crypto buyers are back. And this time? They could hold for the possibility that Bitcoin will surpass $100,000 in 2024. You don’t want to miss the next massive crypto bull run like we saw in 2020 and 2021. To know exactly what’s going on and what to buy… Get Access To Benzinga’s Best Crypto Research and Investments For Only $1.
Another day, another all-time high seems to have been the prevailing theme lately. Sticking with working strategies and themes may seem challenging, but fighting the tape is not the answer.
It can feel counterintuitive for traders to go with the trend sometimes. I know! A trader may see a chart going from the bottom left of the chart to the upper right-hand corner and wants to take the other side of the trade badly, even though it is counter-trend. Logic might dictate that whatever market you are following should be selling off, and it continues roaring higher like a roaring bull. While I am not trying to be oversimplified here, I want to reiterate that the trend is indeed your friend.
ENTER TO WIN $500 IN STOCK OR CRYPTO
Enter your email and you'll also get Benzinga's ultimate morning update AND a free $30 gift card and more!
Even when many technical indicators might indicate that a market is overbought (or oversold), a market will oftentimes continue moving in the same direction, leaving many counter-trend traders in its wake. This is the reason that buying pullbacks in a bull market have been the focus here, opposed to trying to pick tops. It is never easy picking tops and bottoms in any market.
This is the major reason that I like to revisit what has been working.
Looking back at the US equity markets over the last couple of weeks, the theme seemed to be bipolar at face value; but has it really? If we take out the fundamental development of the Fed changing stance on interest rates, has the price action been anything more than typical?
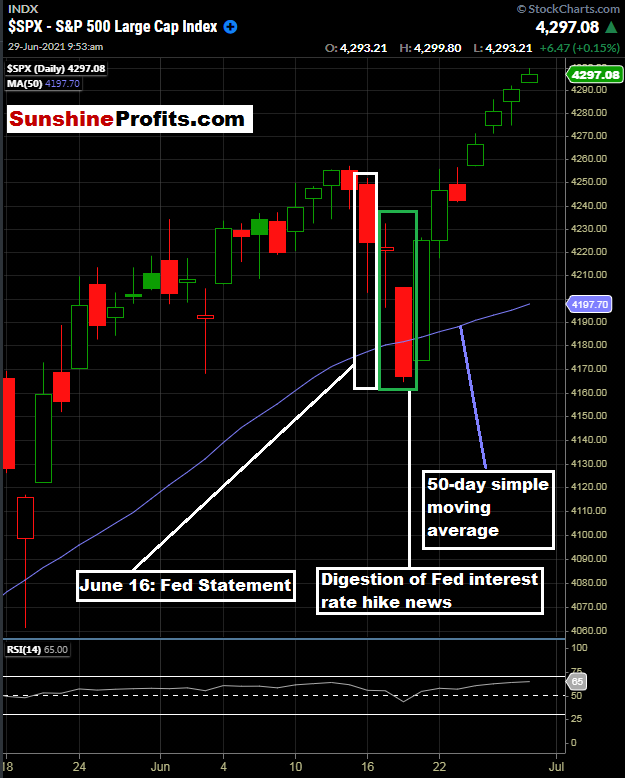
Figure 1 - S&P 500 Index May 18, 2021 - June 29, 2021, 10:00 AM, Daily Candles Source stockcharts.com
I know it felt like the sky was falling when the Fed changed its stance on future interest rate guidance. In reality, the pullback was pedestrian on the day of the event, and the subsequent market digestion brought the S&P 500 to the 50-day SMA (slightly below) for a short period. There is nothing so spectacular about that. It is just the sign of a healthy bull market.
Looking at the pullback that we saw two weeks ago, it was approximately 2.24%. It felt like it was a larger selloff than that, right? That is what happens when the markets are fired up with emotion, and everyone has their take on what is going to happen next.
In reality, if a trader had a plan to buy the pullback at a predefined level, the news of the projected interest rate hikes was just a vanilla buying opportunity. Our readers were prepared, as we have been analyzing what has been working recently: buying the $SPX at the 50-day moving average as detailed on several occasions - including the June 10th publication. It was on our shopping list, and waiting for the pullback was indeed the right move.
It takes discipline, patience, and execution.
Want Private Access to Benzinga Analyst?
Check out the latest strategies our team of experts are using every week so that you can always adapt to the market like the pros!—Get FULL Access to This Week's Webinar Here.
As the S&P 500 has marched higher since touching the 50-day moving average, we currently have the daily RSI(14) sitting near 65-66 and the index trading near the psychologically round number of 4300. Many traders may use these metrics to take some chips off the table. However, is shorting the market there the right thing to do? Some traders may try, some may succeed, and some will lose. The important message of the day is to trade with the trend, and have a plan in place when conditions are right.
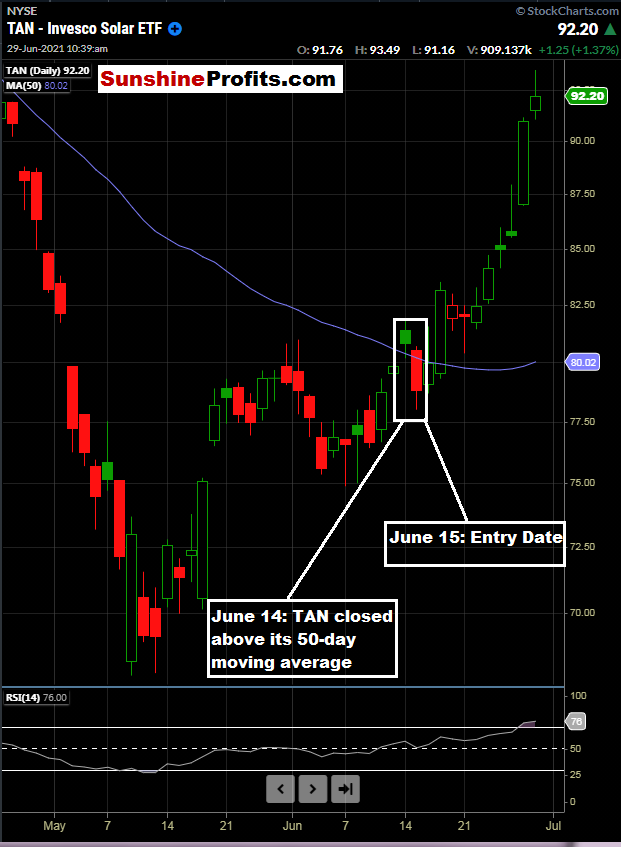
Figure 2 - TAN Invesco Solar ETF April 27, 2021 - June 29, 2021, Daily Candles Source stockcharts.com
On June 14th, Invesco Solar ETF (NYSE:TAN) closed above its 50-day moving average for the first time in a long time. While this entry seems like more of a momentum-based entry, it is important to note that TAN had undergone a long period of consolidation and pullback.
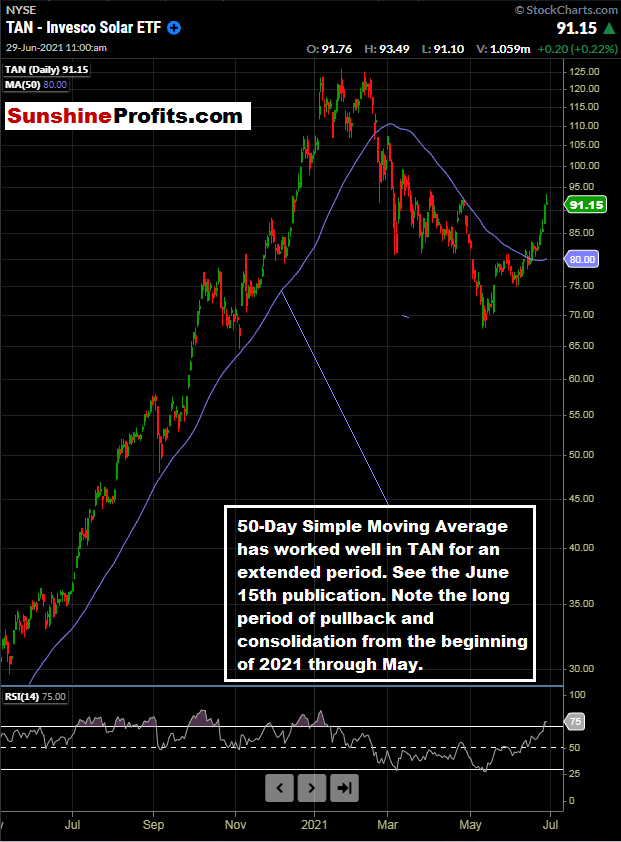
Figure 3 - TAN Invesco Solar ETF May 8, 2020 - June 29, 2021, Daily Candles Source stockcharts.com
So, in this case, we identified a market with a good theme that has pulled back for an extended period. For a trigger, a close above the 50-day SMA made sense.
Let’s take a look in more detail at TAN for any premium subscribers that have open positions. Did I mention that TAN was the top-performing ETF of all unleveraged ETFs yesterday? It was up 6.29% on June 28, 2021.
Rafael Zorabedian Stock Trading Strategist
Sunshine Profits: Effective Investment through Diligence & Care
* * * * *
Crypto Whales Are Loading Up — Are You?
New research shows the biggest crypto buyers are back. And this time? They could hold for the possibility that Bitcoin will surpass $100,000 in 2024. You don’t want to miss the next massive crypto bull run like we saw in 2020 and 2021. To know exactly what’s going on and what to buy… Get Access To Benzinga’s Best Crypto Research and Investments For Only $1.