27% profit every 20 days?
This is what Nic Chahine averages with his option buys. Not selling covered calls or spreads… BUYING options. Most traders don’t even have a winning percentage of 27% buying options. He has an 83% win rate. Here’s how he does it.
I hope everyone in the States had a fun and safe Independence Day. I’m still in Italy with my remote setup, although the truncated week has put a damper on trading activity. I’m obviously not the only trader on vacation.
Given July’s notoriously slow trading environment, I wanted to spend this week’s article breaking down another massively useful trading tool that can signal the trajectory and strength of a stock’s price trend, Volume Weighted Average Price, or VWAP.
ENTER TO WIN $500 IN STOCK OR CRYPTO
Enter your email and you'll also get Benzinga's ultimate morning update AND a free $30 gift card and more!
Like it says on the tin, VWAP is a weighted average of a stock’s trading price that emphasizes price points with the most amount of transactions. VWAP is calculated by taking the average trading price on a single candle and multiplying it by the total number of trades in that candle. Each period is then added together and divided by the total volume traded for the day to arrive at VWAP.
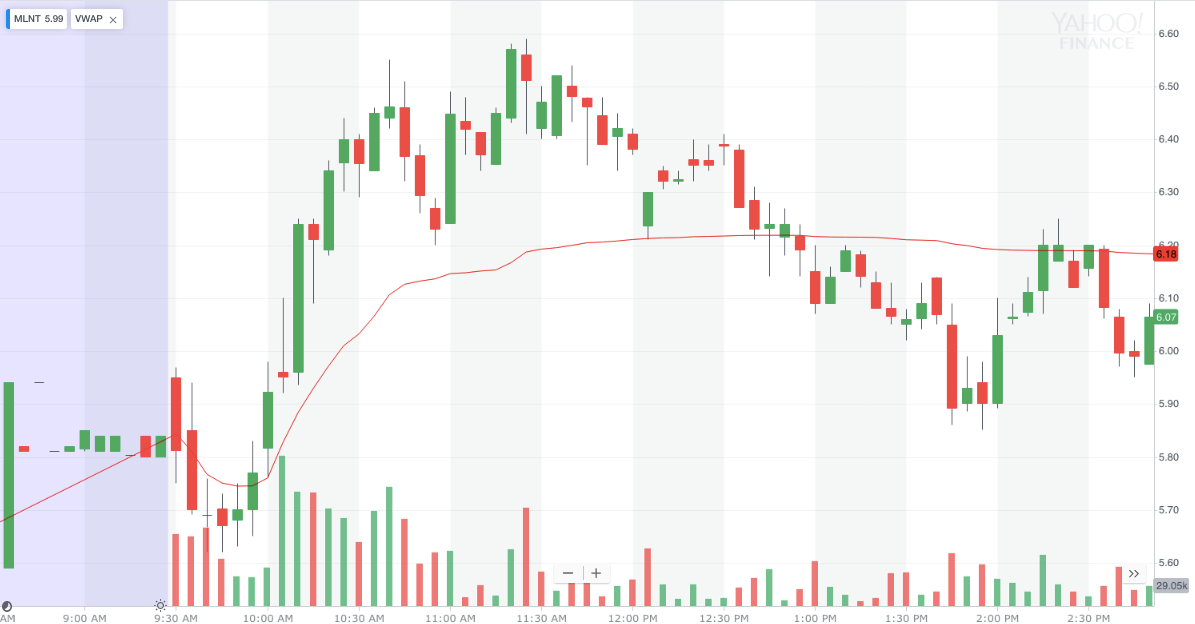
Because of its emphasis on trading volume, most day traders use VWAP as a momentum indicator. The chart below on Melinta Therapeutics Inc. (NASDAQ:MLNT) should provide a good illustration as to why.
See how the red VWAP line responds to changes in both price and volume? The levels described by the line, as well as VWAP’s relationship to MLNT’s actual price, serve as potential trading signals.
One of the most telling points on a majority of VWAP charts is the point at which a stock's price breaks over VWAP. For MLNT, that occurs just before the 10 a.m. mark. While this is clearly the best entry point in retrospect, I would likely wait until volume picked up in the following few minutes for confirmation. While that confirmation comes in a variety of ways, particularly the surge in volume, the chart’s positive deviation from VWAP only solidifies the strong buying pressure.
From a risk management perspective, the high of the move and the point at which VWAP flattened out represents a perfect point to readjust a position in MLNT.
However, even during the stair-step down from the $6.50 level, the spread between MLNT and VWAP suggests the consolidation is only temporary. The flat VWAP can now act as a support level, and MLNT does stagger back up to hit that day’s high of $6.59.
You can see this relationship again in the final bounce off of VWAP just after noon, but the strong selling pressure just before 11:30 should be signal enough that traders are looking to close out.
Warrior Trading is a content partner of Benzinga
27% profit every 20 days?
This is what Nic Chahine averages with his option buys. Not selling covered calls or spreads… BUYING options. Most traders don’t even have a winning percentage of 27% buying options. He has an 83% win rate. Here’s how he does it.