27% profit every 20 days?
This is what Nic Chahine averages with his option buys. Not selling covered calls or spreads… BUYING options. Most traders don’t even have a winning percentage of 27% buying options. He has an 83% win rate. Here’s how he does it.
As the tech sector has continued to outperform the S&P 500 (SPX) in 2018, IBM (NYSE:IBM) performance has lagged both so far this year.
For almost six years, IBM had been consistently posting revenue declines. It finally broke its 22-quarter streak in the fourth quarter of 2017, and now has two quarters of revenue growth under its belt heading into its earnings report on Wednesday, July 18, after market close.
When it reports Q2 results, IBM is expected to report adjusted EPS of $3.03, up from $2.97 in the year-ago quarter, on revenue of $19.88 billion, according to third-party consensus analyst estimates. Revenue is projected to grow 3.1 percent year over year, from $19.29 billion in Q2 2017.
To return the company to consistent revenue growth, IBM has said it has been focused on what it calls its “Strategic Imperatives”, which encompasses cloud computing, data analytics, mobile technologies and security.
In Q1, IBM reported that Strategic Imperatives revenue grew 10 percent year over year to $9 billion, accounting for a little less than half of the $19.1 billion in total revenue. Cloud revenue, which the company includes in Strategic Imperatives but also breaks out separately, came in at $4.2 billion, up 14 percent year over year.
Despite some signs of improvement across different business lines in recent quarters, analysts have expressed concerns that gross margins declined almost across the board in Q1 2018, except for in the global financing division. Many analysts have indicated this inconsistency in results has kept them on the sidelines until they start to see margins expand and revenue continue to stabilize.
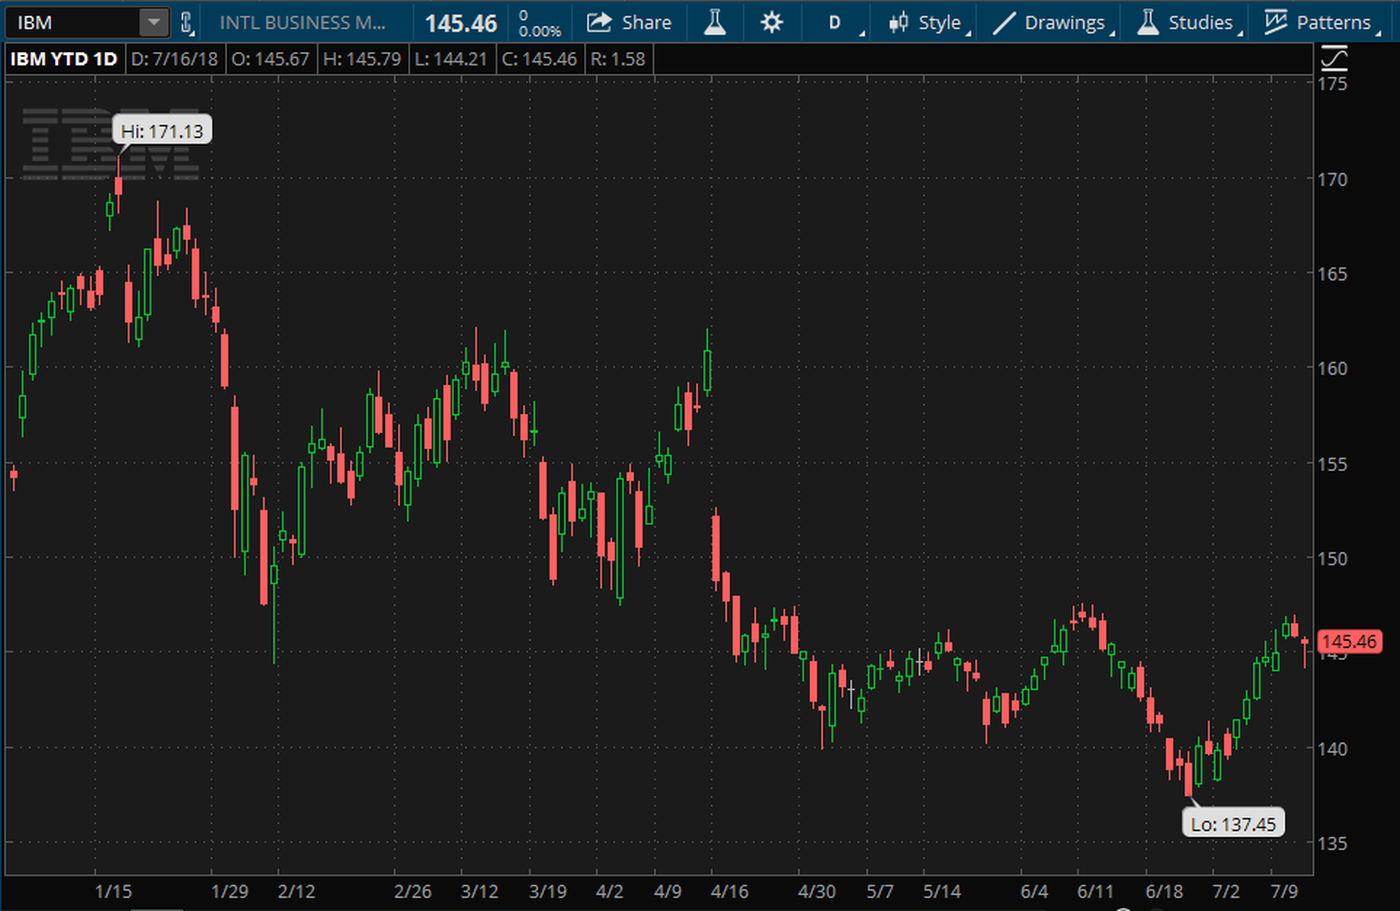
IBM 2018 STOCK CHART. IBM is down 5.7 percent year to date, lagging both the S&P 500 (SPX) and the Dow ($DJI). IBM has been trading in a tighter range since mid-April and has faced some resistance around the $147 level. Chart source: thinkorswim® by TD Ameritrade. Not a recommendation. For illustrative purposes only. Past performance does not guarantee future results.
IBM Trading Activity
IBM gapped down after both of its last two reports, although it was trading at a higher price heading into both. The stock was at $169.12 before its Q4 2017 earnings report, and opened at $164.46 the day after releasing results; it closed at $160.91 before its Q1 2018 report, and opened at $152.14 the day after.
Around the upcoming earning release, options traders have priced in about a 4.1 percent stock move in either direction, according to the Market Maker Move indicator on the thinkorswim® platform. Implied volatility was at the 57th percentile as of this morning.
In short-term trading at the July 20 monthly expiration, volume has been higher on the call side, with trading concentrated at the 145 and 146 strike prices. There’s also been higher volume at the 152.5 strike, a decent ways out of the money. On the put side, both the 142 and 145 strike prices have been more active over the past few sessions.
Note: Call options represent the right, but not the obligation, to buy the underlying security at a predetermined price over a set period of time. Put options represent the right, but not the obligation to sell the underlying security at a predetermined price over a set period of time.
What’s Coming Up
Microsoft Corporation (NASDAQ:MSFT) reports after market close on Thursday, July 19 and General Electric Company (NYSE:GE) takes the stage before the open on Friday, July 20.
Next week is jam-packed with reports from major companies across sectors. Some of the names on the docket include Alphabet Inc. (NASDAQ:GOOG) (NASDAQ:GOOGL), Boeing Corp (NYSE:BA), Facebook, Inc. (NASDAQ:FB), McDonald’s Corporation (NYSE:MCD), AT&T Inc. (NYSE:T), ExxonMobil Corporation (NYSE:XOM) and Amazon.com, Inc. (NASDAQ:AMZN).
Information from TDA is not intended to be investment advice or construed as a recommendation or endorsement of any particular investment or investment strategy, and is for illustrative purposes only. Be sure to understand all risks involved with each strategy, including commission costs, before attempting to place any trade.
For a look at what else is going on, make sure to check out today’s Market Update if you have time.
27% profit every 20 days?
This is what Nic Chahine averages with his option buys. Not selling covered calls or spreads… BUYING options. Most traders don’t even have a winning percentage of 27% buying options. He has an 83% win rate. Here’s how he does it.
ENTER TO WIN $500 IN STOCK OR CRYPTO
Enter your email and you'll also get Benzinga's ultimate morning update AND a free $30 gift card and more!