Two utility stocks are trading like AI plays – and they’re approaching levels that will define the next move.
Both generate electricity. But as data centers multiply and AI infrastructure demands more power than the grid was built to handle, investors have stopped treating these two like traditional utilities. What comes next depends on whether buyers keep showing up at the same levels they’ve defended before.
Both stocks are sitting between well-defined support and resistance right now – and with AI power demand still dominating the market conversation, the setup is worth watching closely this week.
Here’s exactly where those levels are, and what to look for as the week develops.
Why VST and TLN Aren’t Trading Like Utilities
Utility stocks are traditionally slow-moving, yield-focused, and largely immune to the kind of momentum trading that drives tech names. Vistra (VST) and Talen Energy (TLN) have broken that mold entirely.
Both companies are electricity producers – but the explosive growth in data center construction and AI infrastructure has reframed how investors think about power generation. Electricity demand forecasts keep rising, and companies that can supply that power at scale are being priced accordingly. VST and TLN have been among the clearest examples of that shift, posting the kind of price moves that would look at home in a high-growth tech portfolio.
The big moves are already in the past. What traders are evaluating now is whether the underlying demand thesis is strong enough to keep buyers defending these stocks through a period of consolidation – and whether momentum can rebuild toward resistance.
Vistra (VST): The Levels to Watch
Analyst rating: 83.3 on Benzinga Pro
- Primary support: $140.00-$149.00
- Secondary support: $108.50-$130.00
- Resistance: $186.50-$203.50
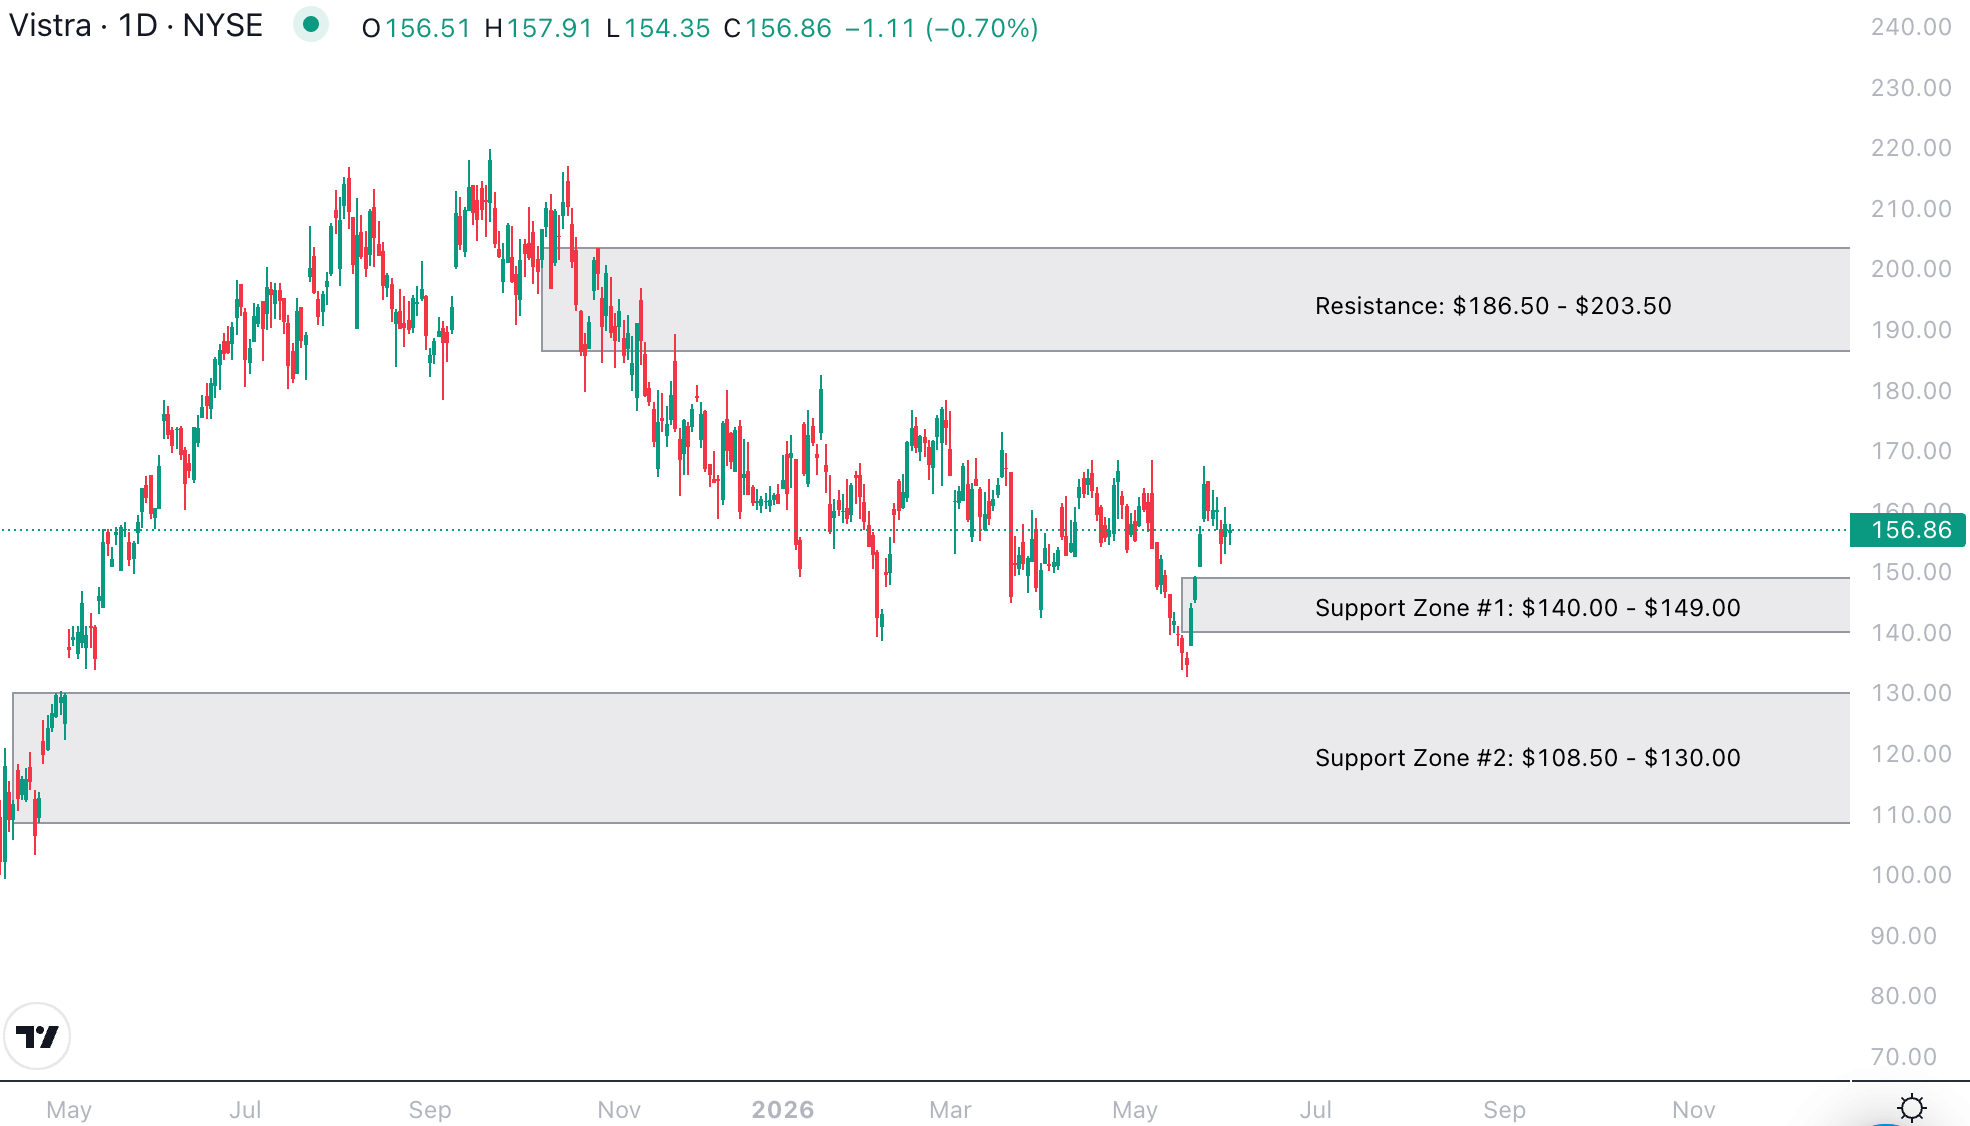
On the daily timeframe, VST remains above its nearest support zone while continuing to consolidate below resistance. Short-term price behavior near current levels will help determine whether buyers can begin rebuilding momentum toward overhead resistance.
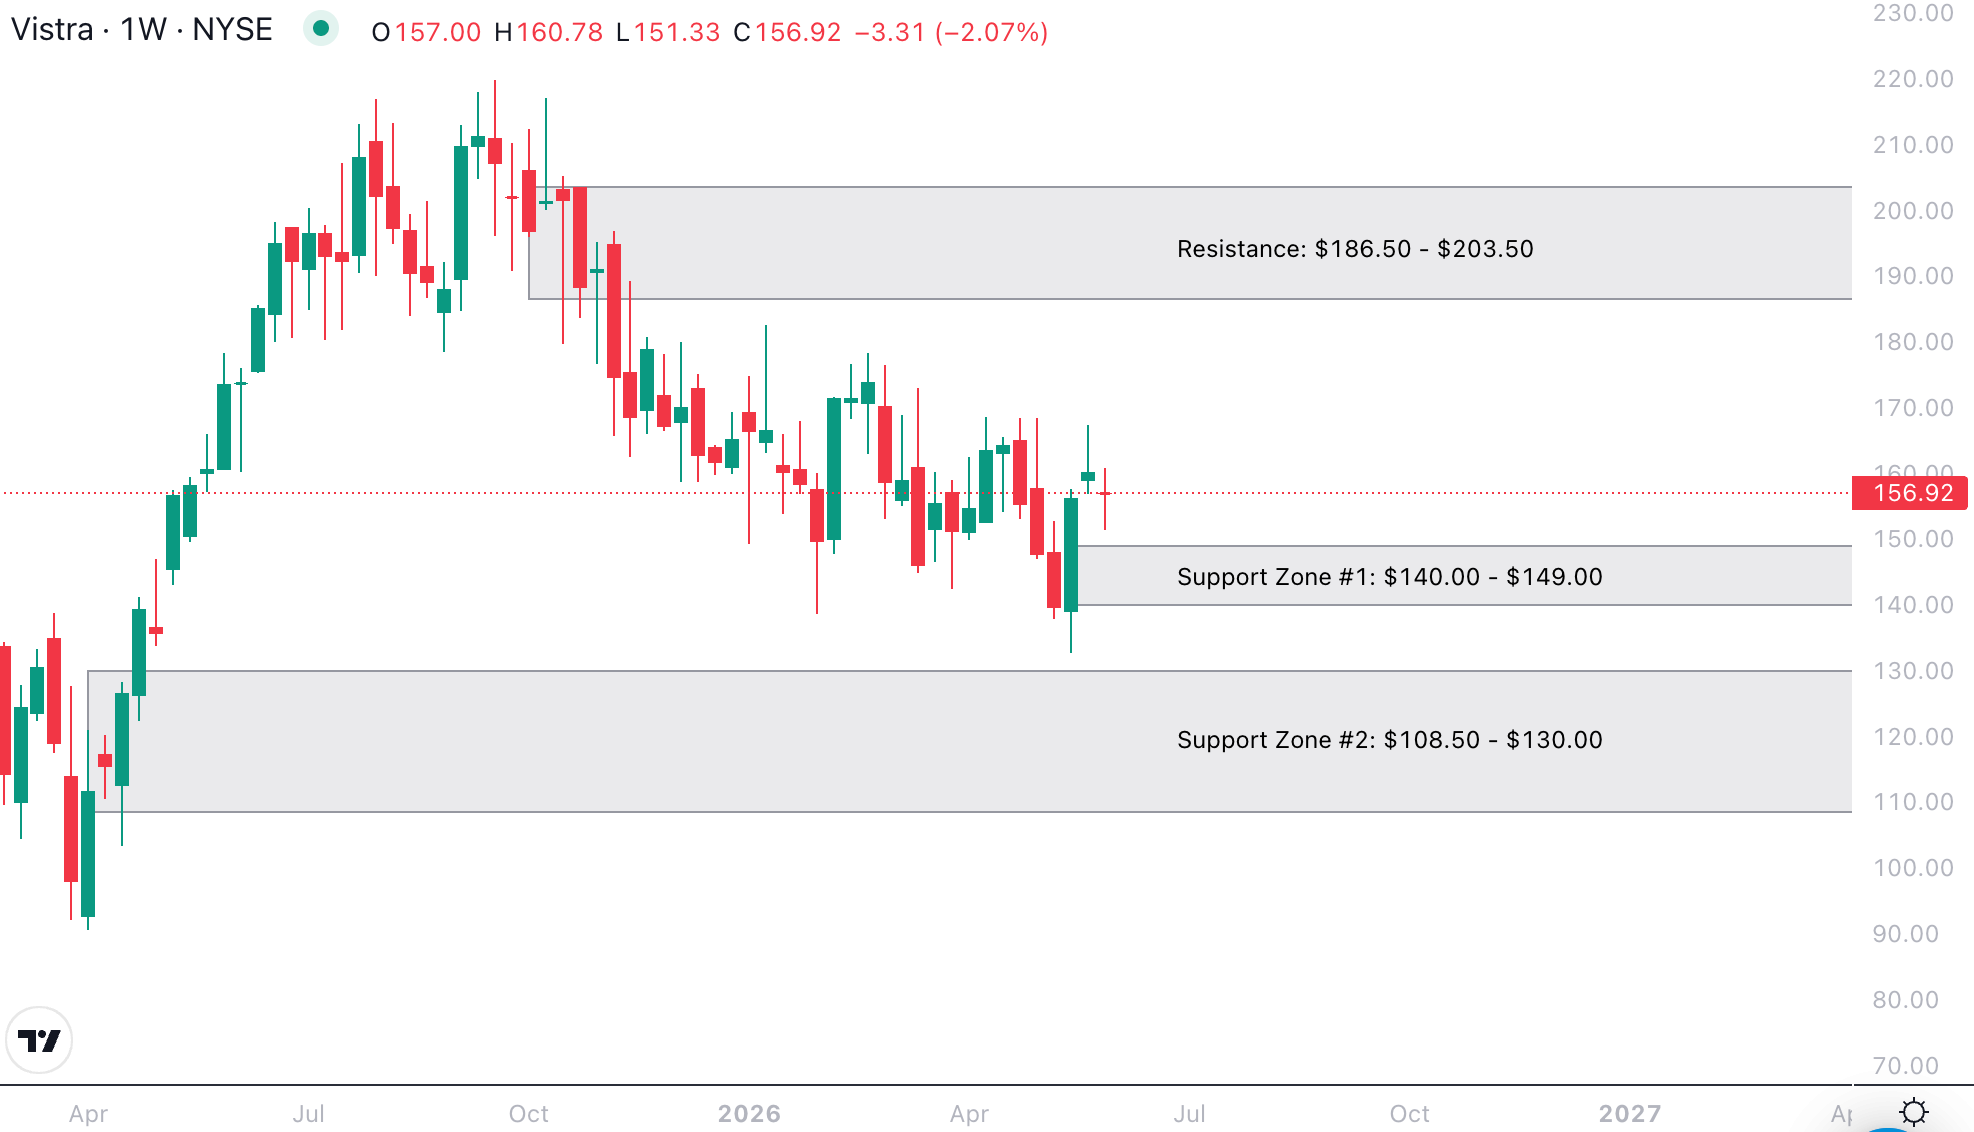
On the weekly timeframe, the structure is clear. The $140.00-$149.00 zone is where buyers most recently stepped in and stopped the decline – that’s the primary level to watch if weakness returns. Below that, $108.50-$130.00 represents a larger historical floor where buyers established a more durable base before the stock’s advance accelerated. Above current price, $186.50-$203.50 is where recent rallies have repeatedly stalled – the next major overhead barrier that buyers would need to clear to signal genuine continuation.
VST’s 83.3 analyst rating reflects continued institutional confidence in the name even below prior highs. For traders using Benzinga Pro alerts, $140.00 and $186.50 are the two levels worth flagging now.
Talen Energy (TLN): A Mirror Setup
Analyst rating: 75.0 on Benzinga Pro
- Primary support: $338.00-$360.40
- Secondary support: $239.00-$272.50
- Resistance: $416.50-$445.00
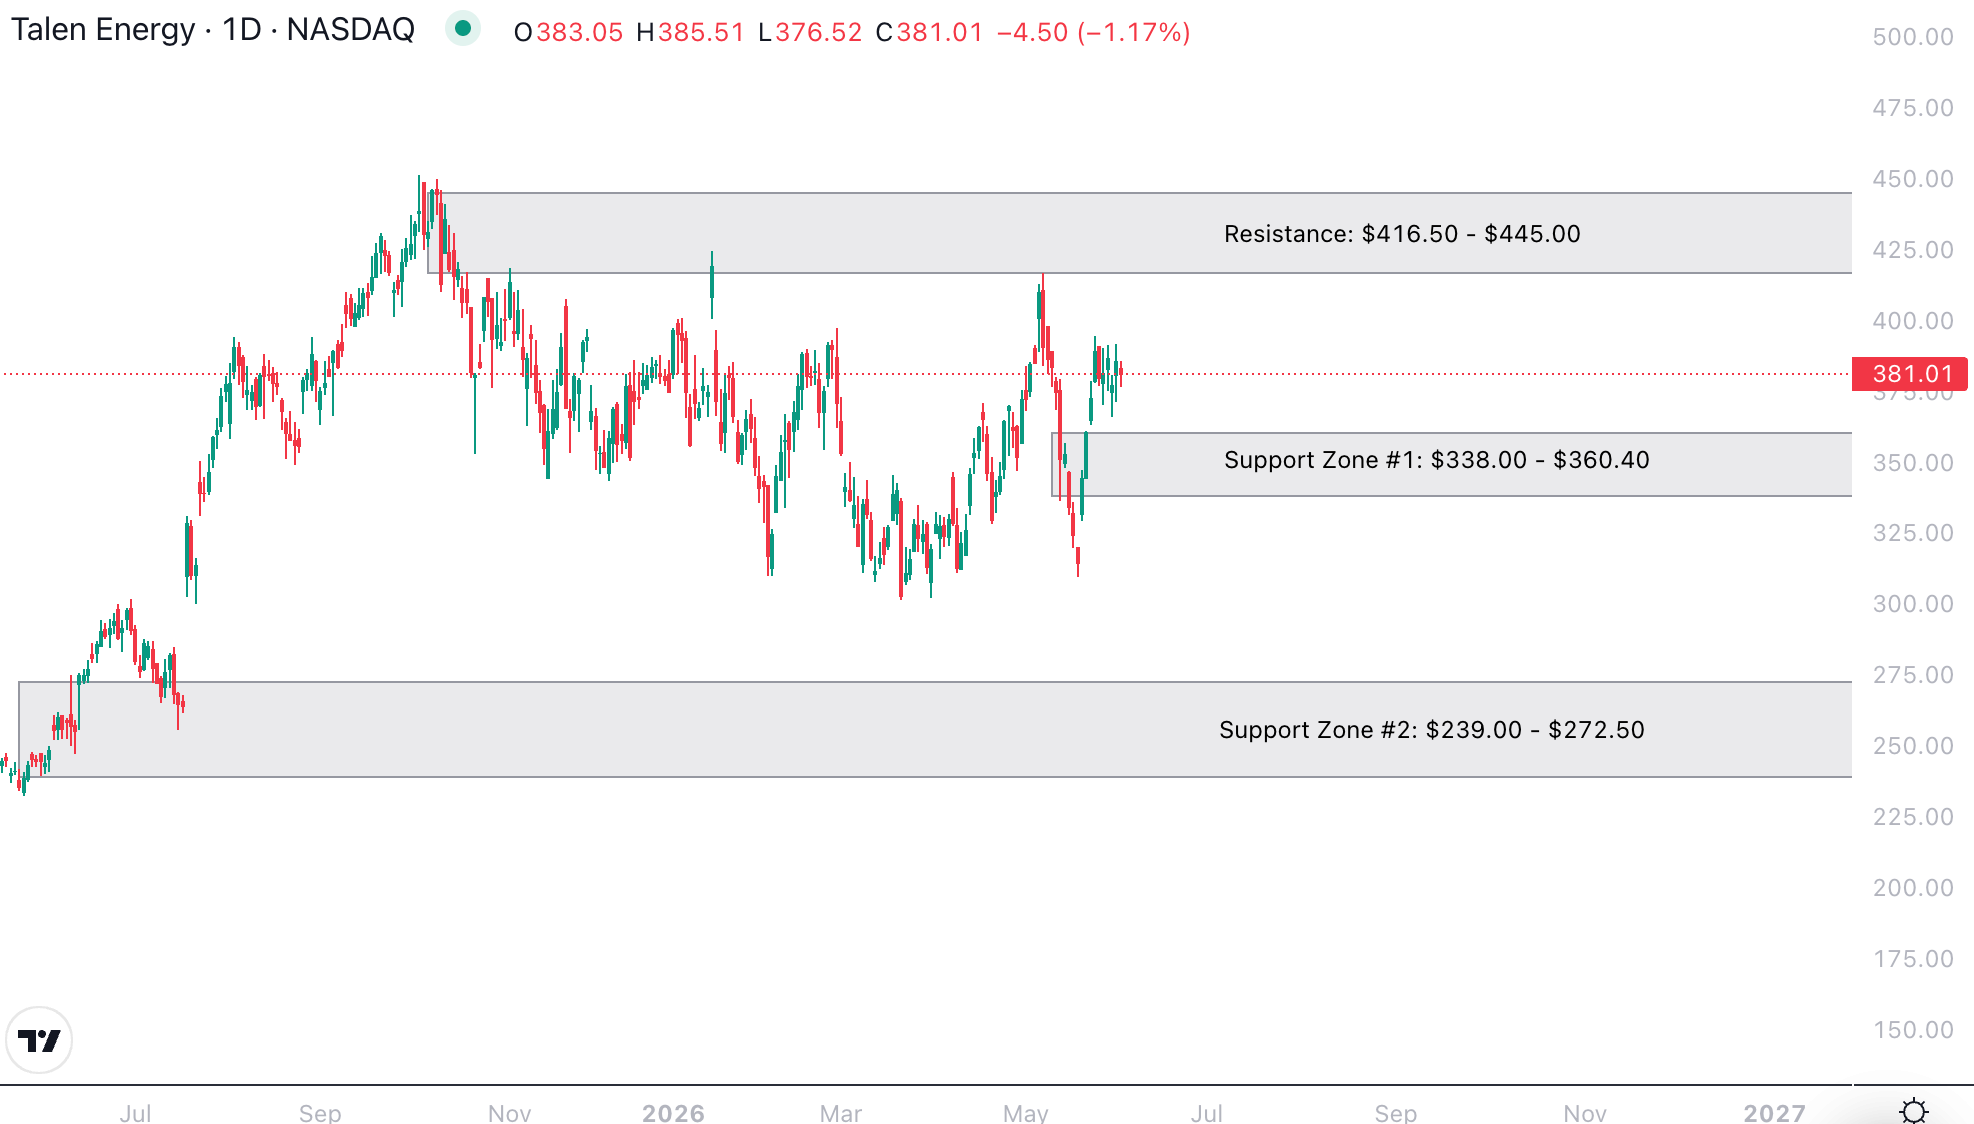
On the daily timeframe, TLN remains above its nearest support zone while attempting to stabilize following recent volatility. Short-term price behavior around current levels will help determine whether buyers can continue rebuilding momentum toward resistance.
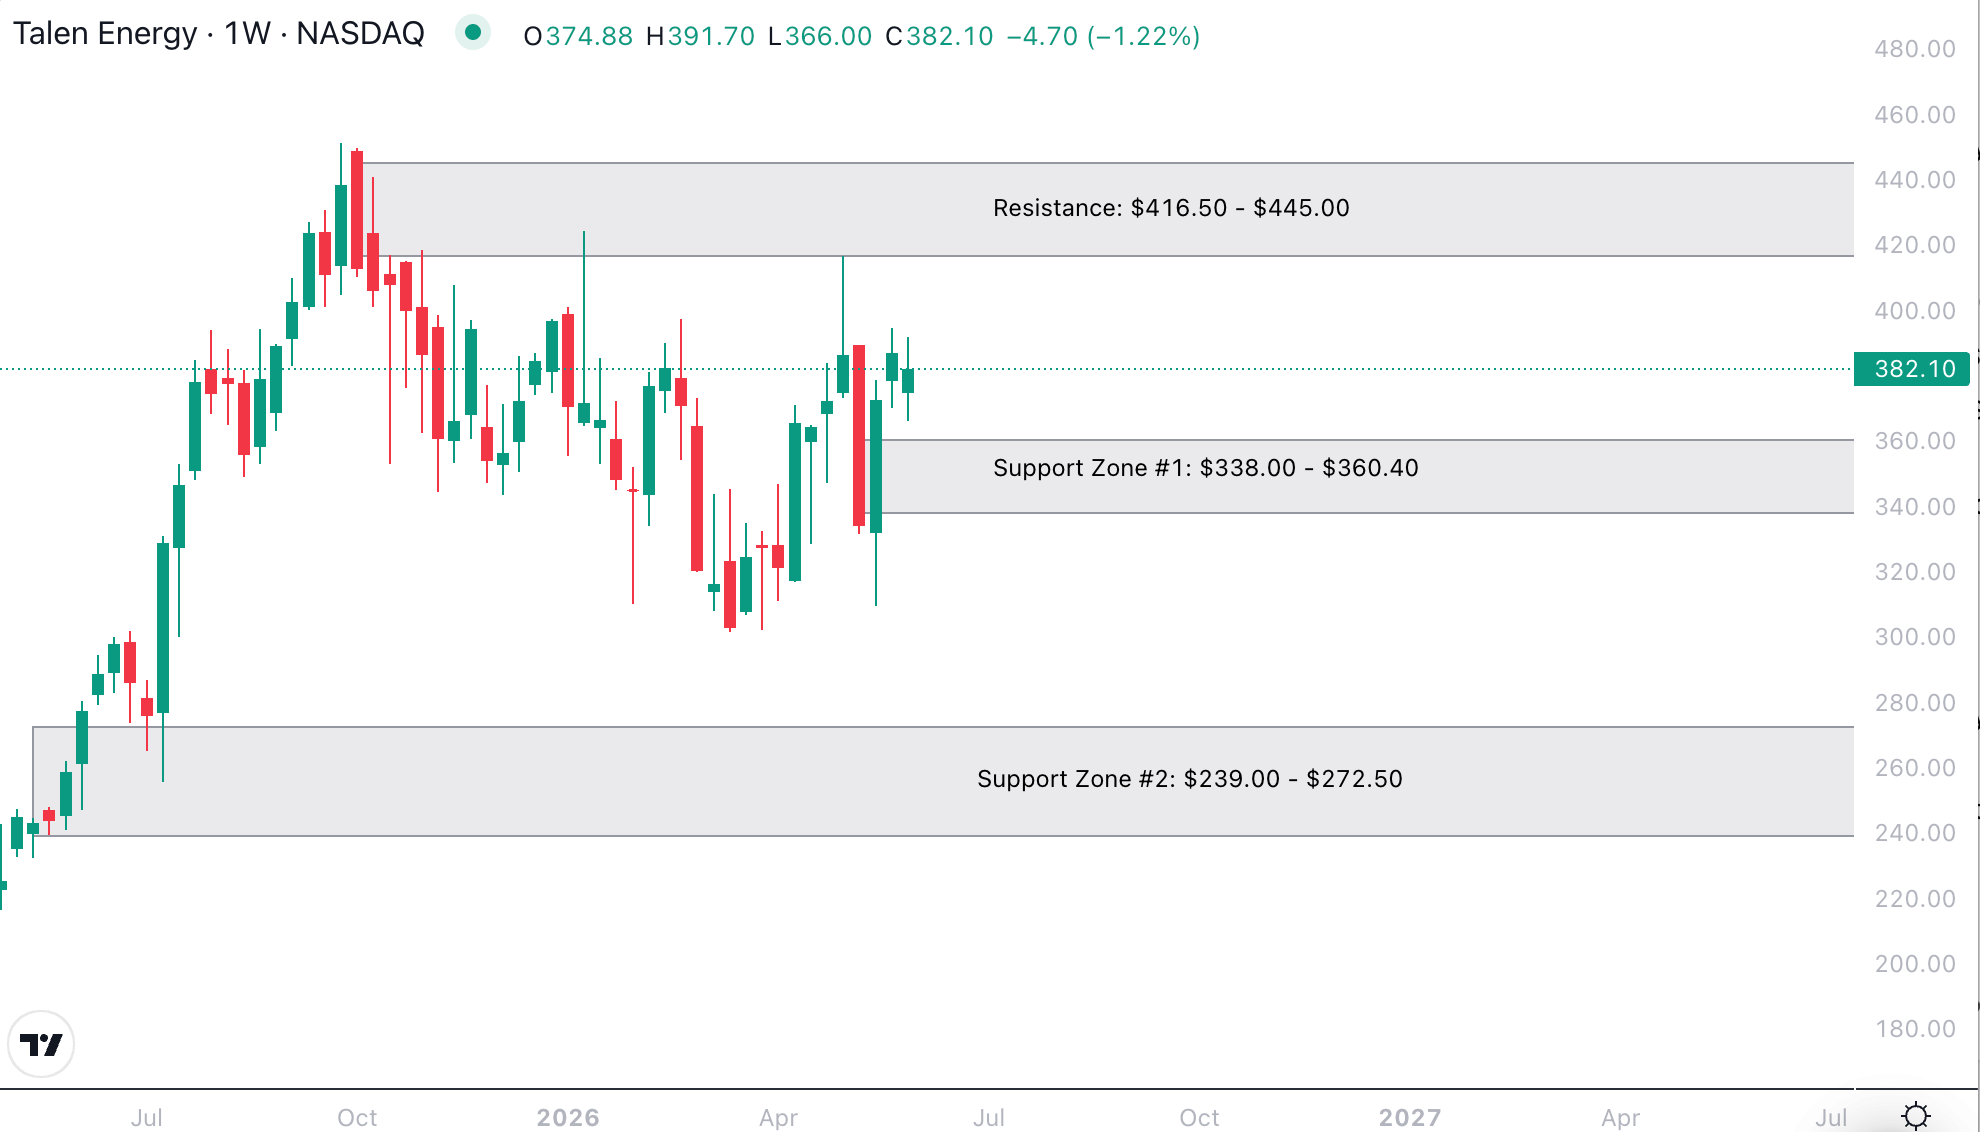
On the weekly timeframe, TLN mirrors the Vistra structure almost exactly. The $338.00-$360.40 zone is where buyers most recently responded – the closest and most immediately relevant reference point. Further below, $239.00-$272.50 is where buyers were acquiring shares before the stock’s advance accelerated. Above current price, $416.50-$445.00 is where previous upside momentum broke down – the zone where the next meaningful test of buyer conviction will occur.
Traders can use Benzinga Pro’s newsfeed to track energy-related developments – power demand forecasts, data center announcements, grid capacity headlines – that could act as catalysts for either name.
Reading the Two Together
The reason to track VST and TLN as a pair is the same reason their charts look so similar: they’re driven by the same underlying theme. When both are holding support at the same time, it suggests the AI power demand thesis is still intact at the investor level – not just in headlines, but in actual capital being committed. When one starts breaking down while the other holds, the signal becomes less reliable.
The explosive phase of this trade has already happened. What’s being evaluated now is durability – whether the demand story is strong enough to keep buyers engaged through consolidation, and whether momentum can rebuild toward resistance without the narrative doing all the heavy lifting.
That shift from narrative to execution is actually where the most useful setups tend to emerge. The story is widely known. The levels are clearly defined. Now it’s about watching whether the price action confirms what the thesis implies.
What to Monitor This Week
On Benzinga Pro, the tools most relevant to this setup:
- Alerts: Set notifications at VST $140.00 and $186.50, and TLN $338.00 and $416.50 – so the levels are working for you without requiring you to watch the screen all day.
- Analyst ratings: Watch whether Wall Street sentiment holds or shifts as price tests key levels. Both stocks carry favorable ratings – any change there would be meaningful.
- Newsfeed: AI infrastructure, data center buildout, and power demand headlines are the catalysts most likely to drive renewed momentum in either name. A move backed by a real development tends to continue. One that isn’t tends to fade.
- Options activity: Positioning near support or resistance will show whether traders are leaning into the next move or hedging against a breakdown.
- Movers: Watch whether VST and TLN are moving together and whether other power and energy names are confirming the move – that would give the signal broader weight beyond just two stocks.
The Bottom Line
Vistra and Talen aren’t trading like utilities. They’re trading like the infrastructure plays the AI buildout has made them – and right now, both are sitting between clearly defined levels that will determine whether the next phase of that trade is a continuation or a consolidation.
The thesis is well established. The levels are on the chart. What matters now is whether buyers keep showing up.
Set your alerts, watch the positioning, and let the price action tell you what’s actually happening – not just what the narrative says should happen.
Benzinga Pro gives you the tools to track it all in real time – charts, options flow, analyst ratings, and breaking news in one place. Start your free trial and be ready when the market opens tomorrow.