

Markets respond to information faster than anything else, and most of that information begins with a headline. An earnings update, a regulatory note, a product issue, even a short line from an analyst can move a stock before the chart shows any sign of it. Traders and researchers depend on structured news because it gives them a clearer starting point and keeps them from jumping between scattered sources.
Benzinga’s Newsfeed and Why Is It Moving (WIM) endpoint is built around that need. It delivers real-time headlines along with symbols, tags, timestamps, and short explanations that point to the reason behind a move. The data comes in a format that fits well into trading systems, lightweight dashboards, or internal research scripts, so you spend less time cleaning news and more time using it.
This guide covers the endpoint from top to bottom. We’ll look at how the data is structured, how the parameters shape the response, and how to pull it into Python for different workflows. The plan is simple. Once you finish the article, you should be able to build your own news-based tools without guessing what each field is supposed to represent.
What is Benzinga’s Newsfeed and WIM endpoint?
News plays a specific role in how markets behave. Prices move for many reasons, but the earliest signals usually appear in headlines. A company might release guidance, an analyst may revise a target, or a regulatory body could publish something unexpected. These events shape sentiment before the broader market reacts.
Most traders do not read every article that comes out. They look for structure. They care about the symbol, the category, the time, the importance, and a short idea of what happened. If the headline mentions a filing or an earnings update, they want to know that quickly. If a stock is moving without any obvious reason, they want the explanation without digging through multiple sources.
This is why structured news feeds matter. Raw headlines alone are not enough. What helps is metadata that groups stories by category, attaches relevant tickers, and adds context about why the event may matter. When these fields are consistent and easy to filter, the news can become part of a trading system instead of something you check manually.
Benzinga’s Newsfeed and WIM endpoint is built around these needs. It does not just deliver text. It provides a clean set of attributes that describe each item. This makes it easier to build alerts, track catalysts, and connect headlines with intraday market activity. The entire point is to reduce guesswork and let the data slot into tools that run throughout the day.
Endpoint Walkthrough
The Newsfeed and Why Is It Moving service exposes two REST endpoints.
- GET https://api.benzinga.com/api/v2/news
- GET https://api.benzinga.com/api/v2/news-removed
In practice, you use the first one to pull articles and WIM items, and the second one only if you are syncing a local store and need to remove items that were taken down.
Base call and authentication
Every request needs your API key passed as token in the query string, plus an accept header.
import requests

api_key = "YOUR API KEY"
url = "https://api.benzinga.com/api/v2/news"

headers = {"accept": "application/json"}
params = {
    "token": api_key,
    "tickers": "AAPL",
    "pageSize": 10,
    "displayOutput": "full"
}

r = requests.get(url, params=params, headers=headers)
data = r.json()
data[0]
The displayOutput=”full” flag is important if you want the full HTML body instead of just a headline or teaser.
Key query parameters
You do not need every parameter. For most workflows, a small subset is enough.
| Field | Type / Example | What it Controls |
| token | YOUR_API_KEY | Authentication. Required for every request. |
| page | 0, 1, 2 | Page offset for pagination. Default 0. |
| pageSize | 10, 50 | Number of results. Max 100. |
| displayOutput | headline, abstract, full | Level of content returned. Use full for body text. |
| date | 2025-11-19 | Single day shortcut for dateFrom and dateTo. |
| dateFrom | 2025-11-18 | Start date for a range query. Sorted by published date. |
| dateTo | 2025-11-19 | End date for a range query. |
| updatedSince | Unix timestamp | Delta sync by last update time. Useful for polling. |
| tickers | AAPL, AAPL,MSFT,NVDA | Filter by one or more symbols, comma-separated values (csv). Max 50. |
| channels | Earnings, WIIM, Equities | Filter by channel names or ids. Set WIIM to focus on WIM. |
| topics | AI, autonomous driving | Keyword search across title, tags, and body. |
| authors | Elon Musk Watch, Shanthi Rexaline | Filter by author |
For low latency and production use, it is recommended to use updatedSince as your main filter instead of huge date ranges.
Response fields
Each item in the JSON array is a single article or headline with a consistent structure.
| Field | Example Value | Meaning |
| id | 48941961 | Unique article id. Also appears in the benzinga.com url. |
| author | “Badar Shaikh” | Name of the journalist or contributor. |
| created | “Wed, 19 Nov 2025 00:49:52 -0400” | When the article was first created, RFC 2822 format. |
| updated | “Wed, 19 Nov 2025 00:49:52 -0400” | Last update timestamp. Changes if the story is edited. |
| title | “Elon Musk Says This Is When Tesla…” | Plain text headline. |
| teaser | Short summary string | First sentence or short context, may contain HTML. |
| body | Full HTML article | Complete article content, returned only when displayOutput=full. |
| url | Article url on benzinga.com | Public link to the story. |
| image | List of {size, url} objects | Featured image variations like thumb, small, large. |
| channels | List of {name} objects | Categories such as Equities, Tech, WIIM, Top Stories. |
| stocks | List of {name, isin, exchange} objects | Symbols referenced in the article body. |
| tags | List of {name} objects | Extra tags like themes, people, products. |
Removed news endpoint
If you are persisting news locally, you can periodically call:
GET https://api.benzinga.com/api/v2/news-removed
It returns a simple payload like:
{
  "removed": [
    {"id": 12345678},
    {"id": 23456789}
  ]
}
You then delete or flag those IDs in your store.
Use Case 1: Basic Data Extraction
Most workflows begin with simple retrieval. The Newsfeed endpoint supports several filtered pulls that cover common needs. Below are a few straightforward patterns that help you get familiar with the data.
Recent headlines for a single stock
This is the most direct call. It returns the latest items that reference a given symbol.
import requests

api_key = "YOUR API KEY"
url = "https://api.benzinga.com/api/v2/news"

headers = {"accept": "application/json"}
params = {
    "token": api_key,
    "tickers": "AAPL",
    "pageSize": 10,
    "displayOutput": "headline"
}

r = requests.get(url, params=params, headers=headers)
items = r.json()

for n in items:
    print(n["id"], n["title"])
Output:

Pulling news for multiple stocks
You can pass several symbols as a comma-separated list. This is common when tracking a watchlist.
headers = {"accept": "application/json"}

params = {
    "token": api_key,
    "tickers": "AAPL,NVDA,TSLA",
    "pageSize": 75
}

r = requests.get(url, params=params, headers=headers)
items = r.json()

symbols = set()
for n in items:
    for s in n.get("stocks", []):
        symbols.add(s["name"])

print("Symbols found:", symbols)
This confirms which tickers appeared in the feed and helps you understand how symbols are tagged inside each story.
Symbols found: {'BYDDF', 'AMTM', 'WSHP', 'WYFI', 'WMT', 'CRWV', 'SRPT', 'SPY', 'COIN', 'PLTR', 'RIOT', 'SMCI', 'SMX', 'AAPL', 'CORZ', 'META', 'EQL', 'KLIC', 'GEV', '$SOL', 'NBIS', 'MHUA', 'WULF', 'SMDV', '$XRP', 'MP', 'TSM', 'BAM', 'ACM', 'CRCL', 'SLMT', 'BE', 'BYDDY', 'NVDA', 'FXI', 'XHG', 'MRVL', 'GM', 'ORCL', 'AMKR', 'JXG', 'VOO', 'MSFT', 'U', 'APLD', 'SOND', 'AMD', 'BTC', 'IVP', 'PACS', 'CRNC', 'INM', '$BTC', 'VIVK', 'INTU', 'F', '$ETH', 'EQWL', 'IWM', 'XLK', 'XLE', 'XLV', 'ODD', 'BRBR', 'CRM', 'MSTR', 'VGT', 'FB', 'RSP', 'HXHX', 'AVGO', 'TSLA', 'QQQ', 'AS', 'XLB', 'CSCO', 'AMZN', 'USO', 'ARM', 'IREN', 'VZLA', 'FINV', 'IJR', 'BRK', 'GOOGL', 'FGL', 'CIFR', 'QCOM', '$DOGE', 'PANW', 'GOOG', 'MMS', 'GLW', 'GLD', 'CEG', 'DIA', 'ES', 'INTC'}
Extracting news for a specific date or range
If you want structured downloads or are working with backfills, date filters are the simplest approach.
params = {
    "token": api_key,
    "dateFrom": "2025-11-18",
    "dateTo": "2025-11-19",
    "pageSize": 50,
    "displayOutput": "abstract"
}

items = requests.get(url, params=params, headers=headers).json()
print("Items retrieved:", len(items))
The response comes sorted by published time. You can raise pageSize when collecting larger sets as long as it stays within the allowed limit.
Full article retrieval with displayOutput=full
When you need the complete body text for NLP or internal summaries, set the display mode to full.
params = {
    "token": api_key,
    "tickers": "TSLA",
    "pageSize": 5,
    "displayOutput": "full"
}

item = requests.get(url, params=params).json()[0]
print(item["title"])
print(item["body"][:300], "...")
This returns the HTML version of the article so you can parse it with BeautifulSoup or any other library.
Tesla Rival BYD Could Bring Its Japanese 'Kei' Car To Europe
<p>Chinese EV giant <strong>BYD Co. Ltd.</strong> <a class="ticker-link" data-ticker="BYDDY" data-exchange="OTC" href="https://www.benzinga.com/quote/BYDDY" target="_blank" rel="noopener">(OTC:<a class="ticker" href="https://www.benzinga.com/quote/BYDDY">BYDDY</a>)</a> <a class="ticker-link" data-ti ...
Use Case 2: Applied Filtering and Light Analysis
Once basic extraction is in place, the next step is to shape the feed into something more targeted. In most workflows, this means filtering by channels, tags or symbols, and turning the response into a structure that is easier to scan.
All examples below assume the same base configuration:
api_key = "YOUR_API_KEY"
url = "https://api.benzinga.com/api/v2/news"
headers = {"accept": "application/json"}
Filtering by channels
Channels group stories into broad categories such as Equities, Markets, Tech or WIIM. This makes it straightforward to focus only on certain types of items.
params = {
    "token": api_key,
    "tickers": "TSLA",
    "pageSize": 20
}

items = requests.get(url, params=params, headers=headers).json()

def channel_names(item):
    return [c["name"] for c in item.get("channels", [])]

wiim_items = [n for n in items if "Movers" in channel_names(n)]

for n in wiim_items:
    print(n["id"], n["title"], channel_names(n))
This pattern narrows the feed to stories that Benzinga flags as Movers while still working off the same endpoint.
48990144 Tesla Stock Is Reeling Back Following Previous Gains: What's Going On? ['News', 'Movers']
48944697 Is Saudi Arabia About To Become Big Tech's Next Billion-Dollar AI Playground? ['Government', 'News', 'Regulations', 'Top Stories', 'Movers', 'Tech', 'Media']
Working with tags
Tags offer a simple way to group news by theme or topic.
from collections import Counter

params = {
    "token": api_key,
    "dateFrom": "2025-11-18",
    "dateTo": "2025-11-19",
    "pageSize": 50
}

items = requests.get(url, params=params, headers=headers).json()

tag_counter = Counter()

for n in items:
    for t in n.get("tags", []):
        name = t.get("name")
        if name:
            tag_counter[name] += 1

for tag, count in tag_counter.most_common(10):
    print(f"{tag}: {count}")
This gives a quick view of which themes appeared most often in the selected period.
Donald Trump: 7
Elon Musk: 4
Jeff Bezos: 3
Expert Ideas: 3
zohran mamdani: 2
Jim Chanos: 2
benzinga neuro: 2
electric vehicles: 2
mobility: 2
Michael Burry: 2
Extracting unique tickers from the feed
The stocks field identifies which symbols are involved in each story. A common task is to see which names are getting repeated coverage.
from collections import Counter

params = {
    "token": api_key,
    "date": "2025-11-19",
    "pageSize": 100
}

items = requests.get(url, params=params, headers=headers).json()

symbol_counter = Counter()

for n in items:
    for s in n.get("stocks", []):
        symbol = s.get("name")
        if symbol:
            symbol_counter[symbol] += 1

for sym, count in symbol_counter.most_common(10):
    print(f"{sym}: {count} articles")
This can be used on its own or combined with other data to highlight tickers that are consistently in the news.
NVDA: 15 articles
TSLA: 10 articles
GOOG: 5 articles
AAPL: 4 articles
MSFT: 4 articles
LOW: 4 articles
GOOGL: 4 articles
AMZN: 4 articles
PLTR: 4 articles
TGT: 3 articles
Flattening the feed into a DataFrame
For lightweight analysis, it is often useful to flatten the response into a table.
import pandas as pd

params = {
    "token": api_key,
    "tickers": "AAPL,MSFT,NVDA,TSLA",
    "pageSize": 40
}

items = requests.get(url, params=params, headers=headers).json()

rows = []
for n in items:
    row = {
        "id": n.get("id"),
        "title": n.get("title"),
        "created": n.get("created"),
        "url": n.get("url"),
        "channels": ", ".join(c["name"] for c in n.get("channels", [])),
        "tickers": ", ".join(s["name"] for s in n.get("stocks", [])),
        "tags": ", ".join(t["name"] for t in n.get("tags", [])),
    }
    rows.append(row)

df = pd.DataFrame(rows)
df.head()
This produces a compact view that is easy to filter or export, and serves as a bridge to the more advanced workflows in the next section.

Use Case 3: Combining News with Price Action
In many tools, headlines are not viewed in isolation. They are placed next to recent price moves to give a clearer sense of how the market reacted. The Newsfeed endpoint and the Historical Bar Data endpoint can be combined to build that kind of view.
The example below uses WIIM stories for a single stock and aligns them with intraday bars from the same session.
Pulling WIIM headlines for a symbol
First, request WIIM tagged news for a chosen stock and trading day. The channels filter keeps the response focused on items where Benzinga provides a “Why Is It Moving” explanation.
import requests
import pandas as pd

api_key = "YOUR API KEY"

news_url = "https://api.benzinga.com/api/v2/news"
headers = {"accept": "application/json"}

news_params = {
    "token": api_key,
    "tickers": "TSLA",
    "channels": "Why Is It Moving",
    "date": "2025-11-19",
    "pageSize": 50
}

news_items = requests.get(news_url, params=news_params, headers=headers).json()

rows = []
for n in news_items:
    rows.append(
        {
            "news_id": n.get("id"),
            "created": n.get("created"),
            "title": n.get("title"),
            "url": n.get("url"),
        }
    )

news_df = pd.DataFrame(rows)
news_df["created"] = pd.to_datetime(news_df["created"])
news_df.sort_values("created", inplace=True)
news_df.head(10)
This produces a small table with the headline id, timestamp, title and url. It also ensures the timestamps are in a format that can be joined with price data.

Loading intraday bars for the same session
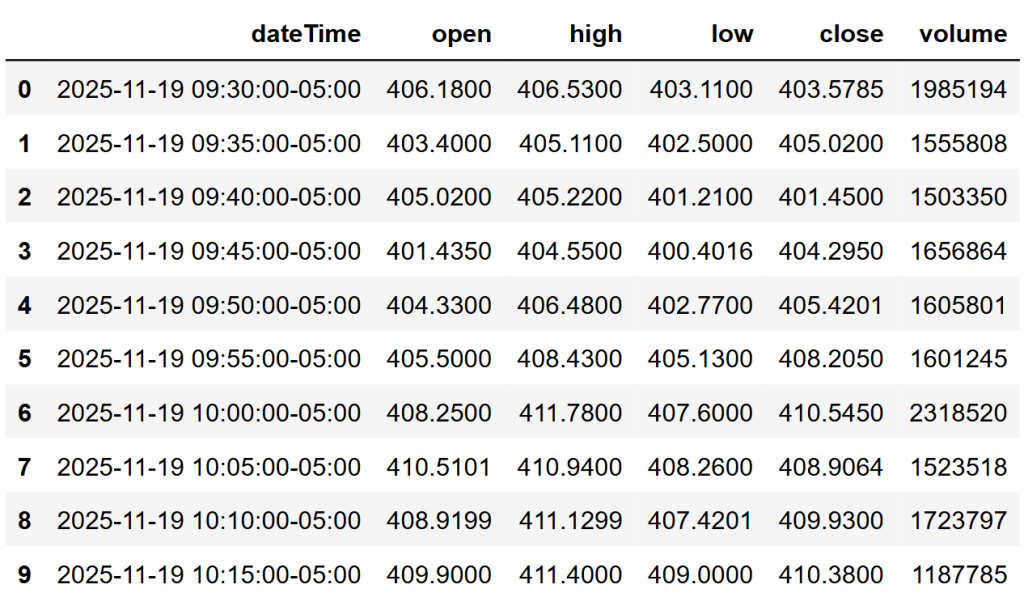
Next, request 5-minute bars for the same symbol and day from the Historical Bar Data endpoint.
bars_url = "https://api.benzinga.com/api/v2/bars"

bars_params = {
    "token": api_key,
    "symbols": "TSLA",
    "from": "2025-11-19",
    "to": "2025-11-20",
    "interval": "5M"
}

bars_resp = requests.get(bars_url, params=bars_params, headers=headers).json()
bars_resp[0].keys()
The response contains one object per symbol, with a candles array for the bar data.
candles = bars_resp[0]["candles"]

bar_rows = []
for c in candles:
    bar_rows.append(
        {
            "dateTime": c.get("dateTime"),
            "open": float(c.get("open", 0)),
            "high": float(c.get("high", 0)),
            "low": float(c.get("low", 0)),
            "close": float(c.get("close", 0)),
            "volume": int(c.get("volume", 0)),
        }
    )

bars_df = pd.DataFrame(bar_rows)
bars_df["dateTime"] = pd.to_datetime(bars_df["dateTime"])
bars_df.sort_values("dateTime", inplace=True)
bars_df.head(10)
At this point, there are two aligned time series. One with discrete news events. One with regular price bars.
Matching WIIM events with nearby price moves
A simple way to study the relationship is to match each news item to the nearest bar and then look at the price before and after the headline.
news_df.created = pd.to_datetime(news_df.created, utc=True)
bars_df.dateTime = pd.to_datetime(bars_df.dateTime, utc=True)

merged = pd.merge_asof(
    news_df.sort_values("created"),
    bars_df.sort_values("dateTime"),
    left_on="created",
    right_on="dateTime",
    direction="forward"
)

bars_df = bars_df.reset_index(drop=True)
bars_df["close_next"] = bars_df["close"].shift(-1)

merged = pd.merge(
    merged,
    bars_df[["dateTime", "close_next"]],
    on="dateTime",
    how="left",
)

merged = merged.drop("close_next_y", axis=1).rename(columns={"close_next_x":"close_next"})

merged["return_next_bar_pct"] = ((merged["close_next"] - merged["close"]) / merged["close"] * 100)

merged = merged.dropna()
cols = ["news_id", "created", "title", "close", "close_next", "return_next_bar_pct"]

merged[cols].tail()
The result is a compact table where each WIIM story is paired with the closing price at the time of the headline and the next bar’s close. It is not a full trading model, but it is enough to support tools that overlay news with price, or to give users a clearer sense of how the market responded around key events.

This pattern can be extended further. For example, by widening the window to several bars, exporting the table to a dashboard, or combining it with other endpoints in the Benzinga suite.
Common Questions About Stock News APIs
What is a news API for stocks?
A news API for stocks provides market headlines in a structured format that includes timestamps, tickers, channels and links. It allows trading systems and research tools to retrieve relevant stories without scraping or manually scanning multiple websites.
How is a stock news API different from a stock data API?
A stock news API focuses on events, while a stock data API focuses on prices and fundamentals. News APIs supply context through headlines and articles. Stock data APIs supply price history, delayed quotes and other numerical data. Both are often used together to understand why a stock is moving and how the market reacted.
Why do traders rely on structured news feeds?
Structured news makes it easier to track specific companies, themes or catalysts. Tickers, tags and channels allow filtering without reading each article individually. This structure also helps connect headlines with intraday price changes or alert systems that surface important updates quickly.
Closing Notes
The Newsfeed and WIM endpoint offers a straightforward way to bring structured market headlines into research workflows and trading tools. It provides consistent fields, reliable timestamps and clear tagging, which makes it easier to filter events, monitor themes and connect headlines with price action.
If you want to explore further or integrate additional data types, the full Benzinga API documentation includes endpoints for quotes, bars and other market datasets that work smoothly alongside the news feed.


