

Introduction
Earnings announcements are one of the few scheduled events that consistently move markets. Prices react not just to the reported numbers, but to how those numbers compare with expectations. A small miss can matter more than a strong result if the market was positioned differently going in.
Benzinga’s Earnings Calendar API provides a structured view of these events. It includes the announcement timing, consensus estimates, reported results and calculated surprise metrics. This makes it possible to track upcoming earnings, review past results and identify where expectations and reality diverged.
In this article, we walk through the Earnings endpoint and show how to work with the data using Python. We start with basic extraction, move on to identifying earnings surprises, and then look at how prices behaved after those events using daily bars. The focus is on building clear, repeatable workflows around earnings data rather than predictive models.
How Earnings Expectations and Surprises Work
What the Market Is Actually Comparing
By the time a company reports earnings, the numbers themselves are rarely a surprise. Analysts have already published estimates, and those expectations are priced in well before the announcement.
What the market reacts to is the comparison. Reported EPS versus the estimate. Reported revenue versus the estimate. That gap is what traders look at first, often before reading anything else.
This is why a stock can drop after reporting “good” numbers or rally after reporting weaker ones. The result only matters relative to what was expected.
What an Earnings Surprise Really Represents
An earnings surprise is simply the difference between what was expected and what was reported. It can be positive or negative, and it can be small or large. The direction tells you whether expectations were beaten or missed. The size tells you how meaningful that miss or beat might be.
EPS surprises tend to get more immediate attention, especially in the first reaction. Revenue surprises often matter more when growth is the focus, or when margins are already under pressure. The Earnings endpoint includes both, along with the calculated surprise values, so you don’t have to compute them manually.
Why Size Matters More Than Direction
Not every beat leads to a move, and not every miss causes a sell-off. Small deviations are common and often ignored. Larger surprises are what usually trigger follow-through.
This is where surprise magnitude becomes useful. It helps separate routine earnings updates from events that actually change how the market views the company, at least in the short term.
That distinction becomes important once you start filtering events or looking at how prices behaved after earnings, which we’ll get to later in the article.
Earnings Calendar Endpoint Walkthrough
The Earnings Calendar endpoint returns one row per earnings event. Each entry combines timing, expectations, reported results and surprise metrics in a single structure. The endpoint is designed to answer a simple question: what was expected, what was reported, and when did it happen.
Base Request
A minimal request looks like this:
import requests

api_key = "YOUR BENZINGA API KEY"
url = "https://api.benzinga.com/api/v2.1/calendar/earnings"

headers = {"accept": "application/json"}
params = {
    "token": api_key,
    "parameters[tickers]": "AAPL",
    "pagesize": 10
}

r = requests.get(url, params=params, headers=headers)
data = r.json()
data["earnings"][0]
The response contains an earnings array, where each element represents a single earnings announcement.
| {‘currency’: ‘USD’, ‘date’: ‘2026-10-29’, ‘date_confirmed’: 0, ‘eps’: ”, ‘eps_est’: ‘1.990’, ‘eps_prior’: ‘1.850’, ‘eps_surprise’: ”, ‘eps_surprise_percent’: ”, ‘eps_type’: ”, ‘exchange’: ‘NASDAQ’, ‘id’: ‘69030cfb619d3a00015b72a3’, ‘importance’: 5, ‘isin’: ‘US0378331005’, ‘name’: ‘Apple’, ‘notes’: ”, ‘period’: ‘Q4’, ‘period_year’: 2026, ‘revenue’: ”, ‘revenue_est’: ”, ‘revenue_prior’: ‘102466000000.000’, ‘revenue_surprise’: ”, ‘revenue_surprise_percent’: ” ‘revenue_type’: ”, ‘ticker’: ‘AAPL’, ‘time’: ’16:00:00′, ‘updated’: 1766187011} |
Key Query Parameters
Most use cases rely on a small set of parameters.
| Parameter | Description |
| tickers | One or more comma-separated symbols. |
| date | Earnings scheduled or reported on a specific day. |
| date_from, date_to | Date range for historical or upcoming earnings. |
| importance | Filter by relevance score (0–5). |
| pagesize, page | Pagination controls. |
This is enough to pull upcoming earnings, review historical results or focus on higher-impact events.
Response Fields
Each record returned by the Earnings Calendar endpoint represents a single earnings event. Some fields are populated only after earnings are reported, while others are available in advance.
Event Timing and Identification:
| Field | Meaning |
| ticker | Stock symbol. |
| name | Company name. |
| exchange | Listing exchange. |
| date | Scheduled or reported earnings date. |
| time | Time of the earnings release. |
| period | Fiscal quarter (e.g. Q1, Q2). |
| period_year | Fiscal year. |
| date_confirmed | Whether the earnings date is confirmed. |
| updated | Last update timestamp. |
EPS Data:
| Field | Meaning |
| eps_est | Consensus EPS estimate. |
| eps | Reported EPS. Empty before release. |
| eps_prior | EPS from the prior period. |
| eps_surprise | EPS difference vs estimate. |
| eps_surprise_percent | EPS surprise percentage. |
| eps_type | EPS classification when applicable. |
Before earnings are released, only the estimate and prior values are populated. Surprise fields remain empty until results are reported.
Revenue Data:
| Field | Meaning |
| revenue_est | Consensus revenue estimate. |
| revenue | Reported revenue. |
| revenue_prior | Revenue from the prior period. |
| revenue_surprise | Revenue difference vs estimate. |
| revenue_surprise_percent | Revenue surprise percentage. |
| revenue_type | Revenue classification when applicable. |
As with EPS, revenue surprise fields are filled only after the announcement.
Metadata:
| Field | Meaning |
| importance | Relevance score (0–5). |
| currency | Reporting currency. |
| isin | Security identifier. |
| notes | Optional notes field. |
| id | Unique earnings record ID. |
A key thing to note is that empty strings are common for fields that are not yet applicable. Any downstream logic should account for that rather than assuming numeric values are always present.
Use Case 1: Basic Earnings Data Extraction
The most common use of the Earnings Calendar endpoint is simply pulling structured earnings data and making it usable. This includes upcoming announcements, historical earnings for a stock, and separating reported results from estimates.
Fetch Upcoming Earnings for a Date Range
To pull upcoming earnings, you typically filter by date or a date range. At this stage, most result fields such as reported EPS or revenue will be empty, while estimates and prior-period values are available.
import requests
import pandas as pd

api_key = "YOUR BENZINGA API KEY"
url = "https://api.benzinga.com/api/v2.1/calendar/earnings"

headers = {"accept": "application/json"}
params = {
    "token": api_key,
    "parameters[date_from]": "2026-10-01",
    "parameters[date_to]": "2026-10-31",
    "pagesize": 10
}

r = requests.get(url, params=params, headers=headers)
earnings = r.json()["earnings"]

df = pd.DataFrame(earnings)
df[["ticker", "date", "time", "eps_est", "eps_prior", "importance"]]

This is useful for building earnings calendars, alerts, or simple watchlists ahead of announcements.
Pull Historical Earnings for a Single Stock
Once earnings have been reported, the same endpoint can be used to retrieve historical results for a ticker.
params = {
    "token": api_key,
    "parameters[tickers]": "AAPL",
    "pagesize": 10
}

r = requests.get(url, params=params, headers=headers)
earnings = r.json()["earnings"]

df = pd.DataFrame(earnings)
df[["date", "period", "eps_est", "eps", "eps_surprise", "eps_surprise_percent"]]

At this point, reported values and surprise metrics begin to appear. Empty strings in unreleased fields should be handled explicitly before any calculations.
Separating Reported vs Upcoming Events
Because the endpoint mixes upcoming and past events, a simple filter helps keep things clean.
reported = df[df["eps"].astype(str).str.strip() != ""]
upcoming = df[df["eps"].astype(str).str.strip() == ""]
This distinction becomes important later when analyzing surprises or linking earnings events to price data. Upcoming entries are useful for planning. Reported entries are what you analyze.
Use Case 2: Earnings Surprise Detection
Once earnings are reported, the surprise fields become the most useful part of the response. They let you quickly see where results diverged from expectations, without having to calculate anything manually.
Identifying Beats and Misses
The simplest way to work with earnings surprises is to separate positive and negative outcomes. This can be done using the surprise percentage fields once reported values are available.
df["eps_surprise_percent"] = pd.to_numeric(
    df["eps_surprise_percent"], errors="coerce"
)

beats = df[df["eps_surprise_percent"] > 0]
misses = df[df["eps_surprise_percent"] < 0]

beats[["ticker", "date", "eps_est", "eps", "eps_surprise_percent"]]
This immediately highlights which companies exceeded expectations and which fell short.

This output shows multiple quarters of earnings for the same stock, with both the estimates and reported EPS visible. In each case here, the reported EPS is higher than the estimate, which results in a positive surprise percentage. This confirms that the filtering logic is correctly isolating earnings beats and excluding upcoming or unreleased events.
Ranking Surprises by Magnitude
Not all beats or misses matter equally. Ranking surprises by size helps surface events that were more likely to influence sentiment.
ranked = df.dropna(subset=["eps_surprise_percent"]) \
           .sort_values("eps_surprise_percent", ascending=False)

ranked[["ticker", "date", "eps_surprise_percent"]].head(10)
Large surprises tend to draw more attention, especially when paired with higher importance scores.

Here, the same earnings events are reordered by surprise size. The most recent quarter is not necessarily the largest surprise. Instead, the ranking highlights which earnings releases deviated most from expectations, regardless of timing. This makes it easier to spot quarters that were genuinely unexpected rather than just “better than expected.”
Filtering High-Impact Earnings
The importance field is useful for narrowing the dataset to earnings that are more likely to be widely followed.
high_impact = df[
    (df["importance"] >= 4) &
    (df["eps_surprise_percent"].notna())
]

high_impact[
    ["ticker", "date", "eps_surprise_percent", "importance"]
]
This keeps the focus on events where expectations, results, and market attention all intersect. These filtered datasets are typically what you would pass into further analysis or event-based workflows.

Once the importance filter is applied, the dataset narrows to earnings events that Benzinga classifies as highly relevant. In this case, all listed earnings carry the maximum importance score, which makes them suitable candidates for deeper analysis or price reaction studies. This step helps remove low-signal earnings before moving on to market impact analysis.
Use Case 3: Post-Earnings Price Reaction
Once earnings surprises are identified, the next step is to see how the market responded. Rather than focusing on intraday volatility, this section looks at daily price behavior after the earnings announcement. The goal is not prediction. It is to understand follow-through.
Preparing Earnings Events for Analysis
We start with reported earnings only and keep the fields needed for alignment.
events = df[
    df["eps_surprise_percent"].notna()
][["ticker", "date", "eps_surprise_percent"]].copy()

events["date"] = pd.to_datetime(events["date"])
events

This ensures we are working only with completed earnings events.
Pull Daily Price Data Around Earnings
For each earnings event, we fetch daily bars using the Benzinga Bars API endpoint around each earnings date and align the event with the next available trading session.
def get_next_close(ticker, event_date):
    bars_url = "https://api.benzinga.com/api/v2/bars"
    params = {
        "token": api_key,
        "symbols": ticker,
        "interval": "1day",
        "from": event_date.strftime("%Y-%m-%d"),
        "to": (event_date + pd.Timedelta(days=5)).strftime("%Y-%m-%d")
    }
    r = requests.get(bars_url, params=params, headers=headers).json()
    bars = pd.DataFrame(r[0]["candles"])
    return bars.iloc[0]["close"], bars.iloc[1]["close"]
This gives us:
- the close immediately after earnings
- the following day’s close
Calculating Post-Earnings Returns
With prices aligned, we can compute the next-day return.
returns = []

for _, row in events.iterrows():
    close_0, close_1 = get_next_close(row["ticker"], row["date"])
    ret = (close_1 - close_0) / close_0
    returns.append(ret)

events["next_day_return"] = returns
events
Now each earnings event has:
- surprise magnitude
- subsequent price reaction
Interpreting the Results

The table shows earnings events with positive EPS surprises alongside the stock’s next-day return. Even though all listed quarters beat expectations, the price reaction is mixed. Some earnings were followed by modest gains, while others saw clear declines the following day.
This highlights an important point. A positive earnings surprise does not guarantee a positive immediate price reaction. In several cases, expectations may have already been priced in, or other factors such as guidance, market conditions, or broader sentiment outweighed the headline beat.
This is exactly why combining earnings data with price data is useful. Surprise metrics alone tell you what changed relative to expectations. Price reactions show how the market actually responded. Looking at both together provides a more realistic view than relying on earnings results in isolation.
Visualizing Next-Day Returns
A table is useful for accuracy, but a quick chart makes the pattern easier to notice. Below, we plot the next-day returns for each earnings event.
events = events.set_index("date")
events.index = events.index.astype(str)
events.next_day_return.plot(kind="bar")
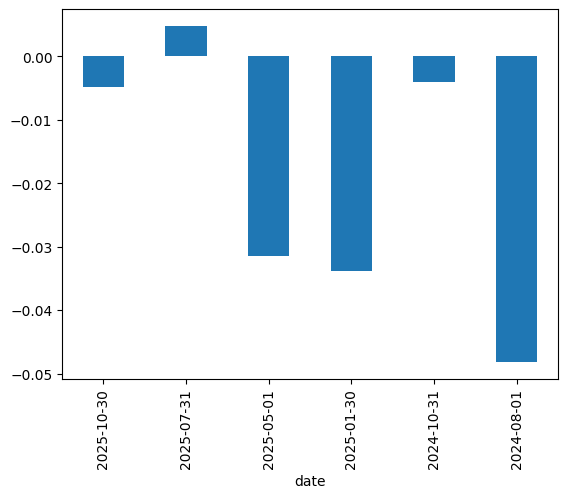
The bar chart makes the same point as the table, but more clearly. Most next-day reactions are negative even though all these quarters had positive EPS surprises. Only one event shows a positive next-day return, and the rest are either small pullbacks or meaningful declines.
This is a good reminder that earnings surprises are only one input. The market’s reaction is often driven by what the company said about the future, what was already priced in, and the broader market context on that day. The value of this workflow is that it lets you measure the reaction directly instead of assuming a beat automatically leads to upside.
FAQs About the Earnings Calendar API
What is the Earnings Calendar API used for?
The Earnings Calendar API provides structured earnings data for stocks, including announcement dates, EPS and revenue estimates, reported results, and surprise metrics. It is commonly used to track upcoming earnings, analyze past results, and study how markets react to earnings announcements.
Does this earnings API include earnings surprise data?
Yes. Once earnings are reported, the API includes both EPS and revenue surprise values, along with their percentage differences versus estimates. These fields remain empty for upcoming earnings and are populated after the announcement.
How is this different from other stock data APIs?
Most stock data APIs focus on prices and volumes. The Earnings Calendar API focuses on corporate events. It provides the expectations, outcomes, and timing of earnings releases, which helps explain why prices may move rather than just showing that they moved.
Can I use this earnings data API with Python?
Yes. The API works well with Python using standard HTTP requests. Earnings data can be easily converted into pandas DataFrames and combined with historical price data for analysis, screening, or research workflows.
Is this suitable for short-term earnings analysis?
It is. Each earnings event includes a clear date and time, making it easy to align with daily or intraday price data. This allows you to measure post-earnings price reactions or build event-driven studies around earnings surprises.
Closing Notes
The Earnings Calendar API makes it easier to work with earnings data in a structured way. It brings together expectations, reported results, and surprise metrics without requiring additional calculations or manual cleanup.
When combined with price data, the endpoint helps move beyond raw earnings numbers and toward understanding how the market actually reacted. This makes it useful for research, screening, and post-event analysis where context matters as much as the result itself.


