20-Year Pro Trader Reveals His "MoneyLine"
Ditch your indicators and use the "MoneyLine". A simple line tells you when to buy and sell without the guesswork. It’s a line on a chart that’s helped Nic Chahine win 83% of his options buys. Here's how he does it.
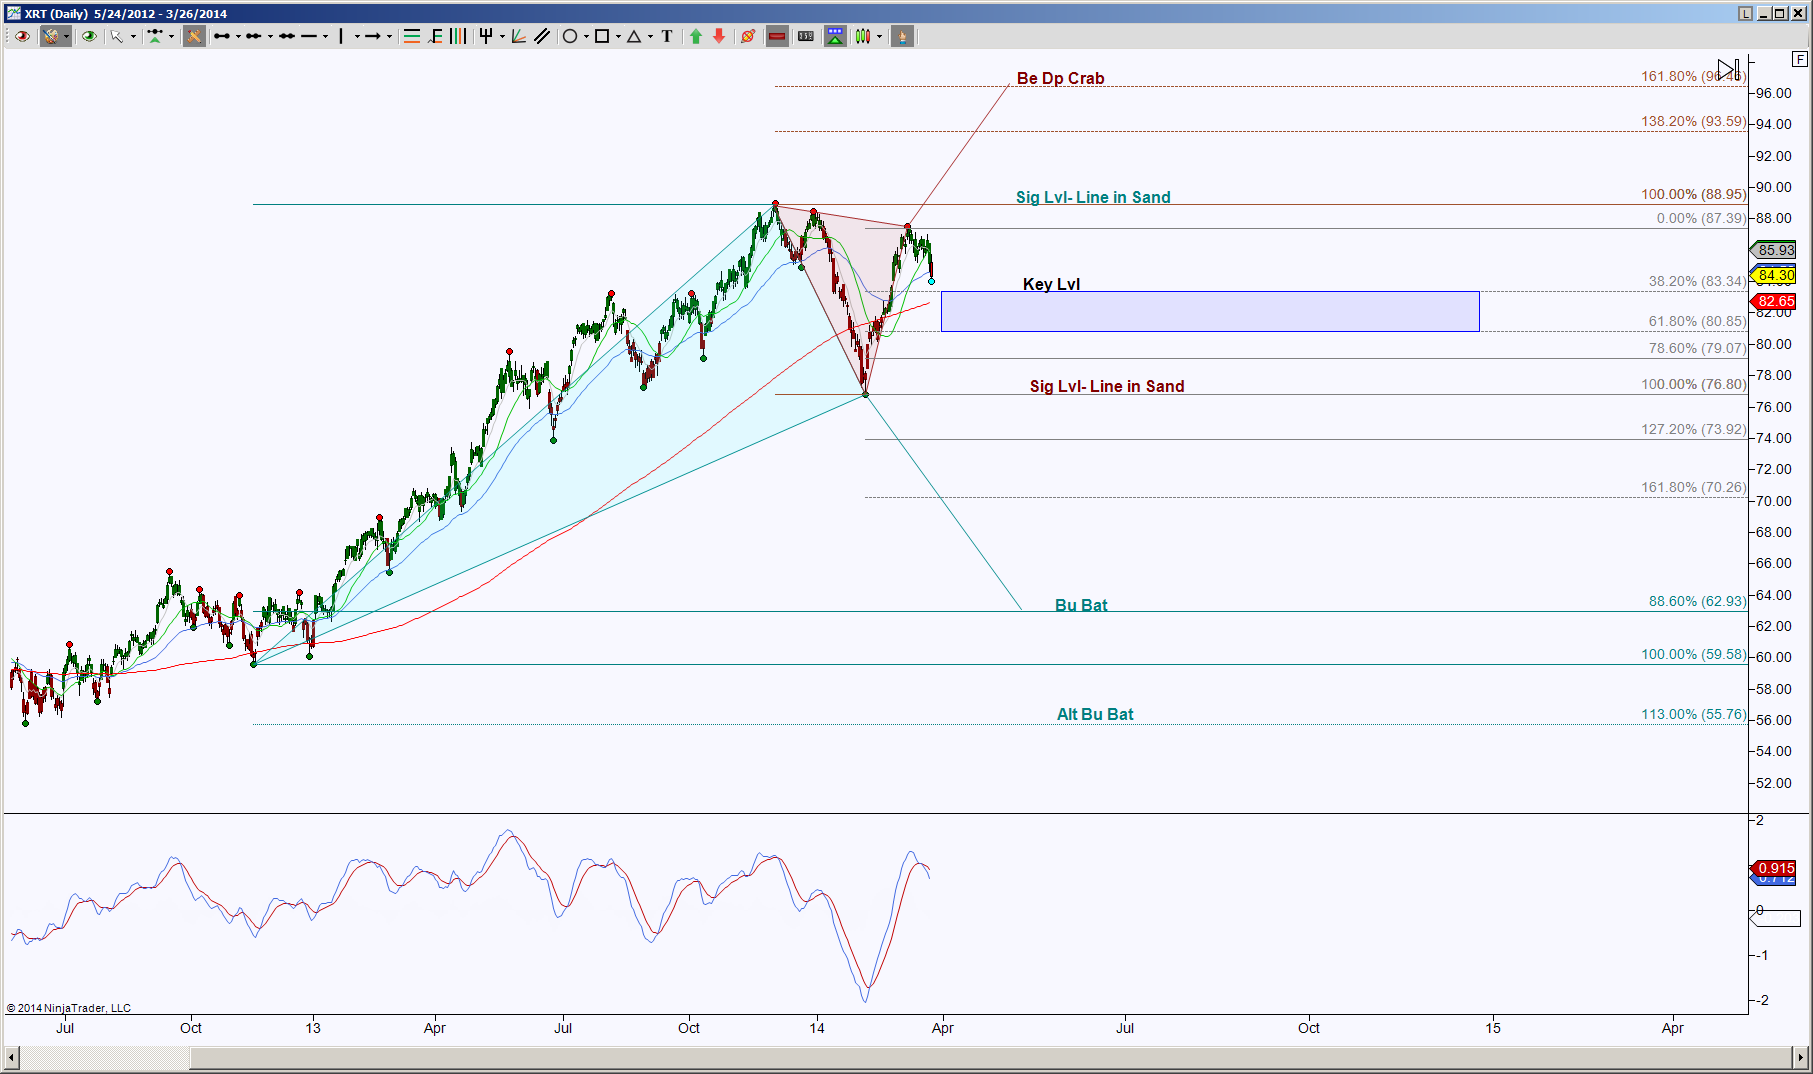
XRT, the ETF for the retail sector, has been in an uptrend with small pullbacks, finally enough of a pullback that is a harmonic requisite for the triangle that begins the harmonic rotation. Although this retracement from an initiative upside move is shallow, it’s enough to create a so-called confusion in what to do now. This is evident anytime there are opposing emerging patterns; however, momentum is attempting to lead price to the downside.
Currently price is falling to test GRZ, which can offer some guidance as to the strength of this pullback. A hold above 83.34 implies an attempt to retest 87.39 or 88.95. Above 88.95 invalidates the cyan-colored pattern and has the ideal upside target at 96.46 and point of interest at 93.59.
A hold below 83.34 has the initial ideal target at 76.80 but points of interest along the way at 80.85 and 79.07. Points of interest, aka scaling points, are potential rejection levels, so they are to be respected for that possibility. A breakdown of 76.80 invalidates the brown-colored pattern and focuses on completing the cyan-colored pattern at 62.93.
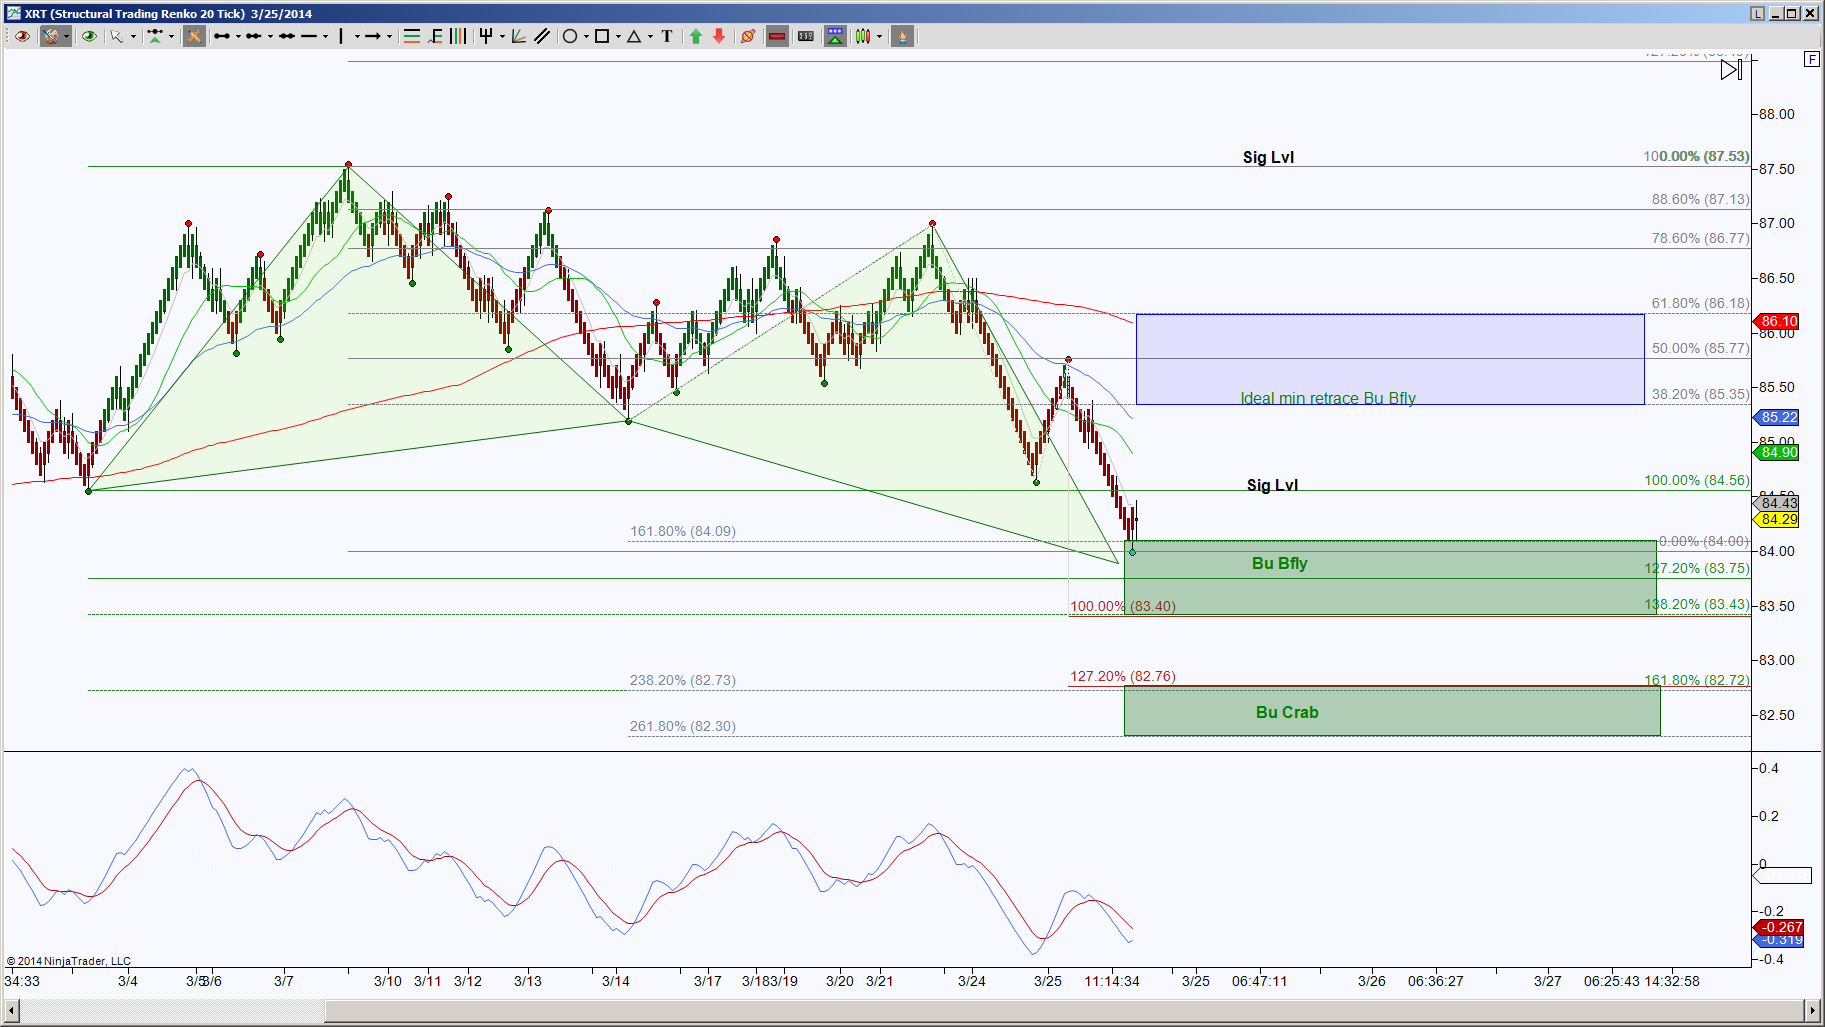
If the bullish pattern, in this case called a Butterfly, generates a respectable retracement, and a hold above 83.35 occurs, the ideal target is 87.53 and the gray fibs along the way as scaling points with emphasis at 86.18.
A hold below 83.43 has the extended PRZ target of 82.76 to 82.30. If bulls cannot find enough energy to retrace this extreme pattern, then the bears are celebrating their strength.
There are times that price will coil or stall in a consolidation type formation when in a PRZ. When this occurs and a valid break from this happens, the move can be swift or powerful. It’s likened to the instrument holding its breath during the coiling and exhaling upon the break.
20-Year Pro Trader Reveals His "MoneyLine"
Ditch your indicators and use the "MoneyLine". A simple line tells you when to buy and sell without the guesswork. It’s a line on a chart that’s helped Nic Chahine win 83% of his options buys. Here's how he does it.
ENTER TO WIN $500 IN STOCK OR CRYPTO
Enter your email and you'll also get Benzinga's ultimate morning update AND a free $30 gift card and more!