


"You’ve got to know when to hold ‘em. Know when to fold ‘em. Know when to walk away. Know when to run."
-Kenny Rogers
The past year for shareholders of Exxon Mobil Corporation XOM has not been pretty. At the end of July of last year, XOM had risen to an all-time high of $104 a share. Now, a year and change later, the stock is off more than 30% and at a four year low. And, for a stock that is highly correlated to the cost of Crude Oil, the near future does not look any more promising.
Last month, the U.S. Energy Information Administration (EIA) lowered their forecast for Crude Oil WTI prices through 2016 to an average of $54 a barrel for the year. This is down from their forecast of $62 a barrel just a month earlier in their Short Term Energy Outlook. Less than two weeks ago, Goldman Sachs cut its 2015 WTI forecasts from $57 to $45 a barrel, basically projecting 2016 to be at current prices. These lowered forecasts are coming even as U.S. energy firms have been cutting oil rigs and production this month.
So, should we hang on or possibly trim, or is this perhaps an opportunity to get bigger?
EidoSearch ran some patterns through our predictive analytics engine. Although the following results don’t carry the statistical significance of some of our recent big market calls, e.g. the S&P 500 rebound, there are some very compelling analogs worth reviewing here.
We first tried looking at 1 and 2 year patterns, but the results were too unique. However, looking 6 months back yielded some interesting results. As opposed to just looking at the current pattern in Exxon Mobil, we ran a multi-variant analysis looking at the patterns in both Exxon Mobil and Crude WTI to see if there are any similar trading environments historically to today. Looking at close to 40 years of history, we found 5 matches.
Exxon Mobil is up an average of 6.8% in the next 3 months.
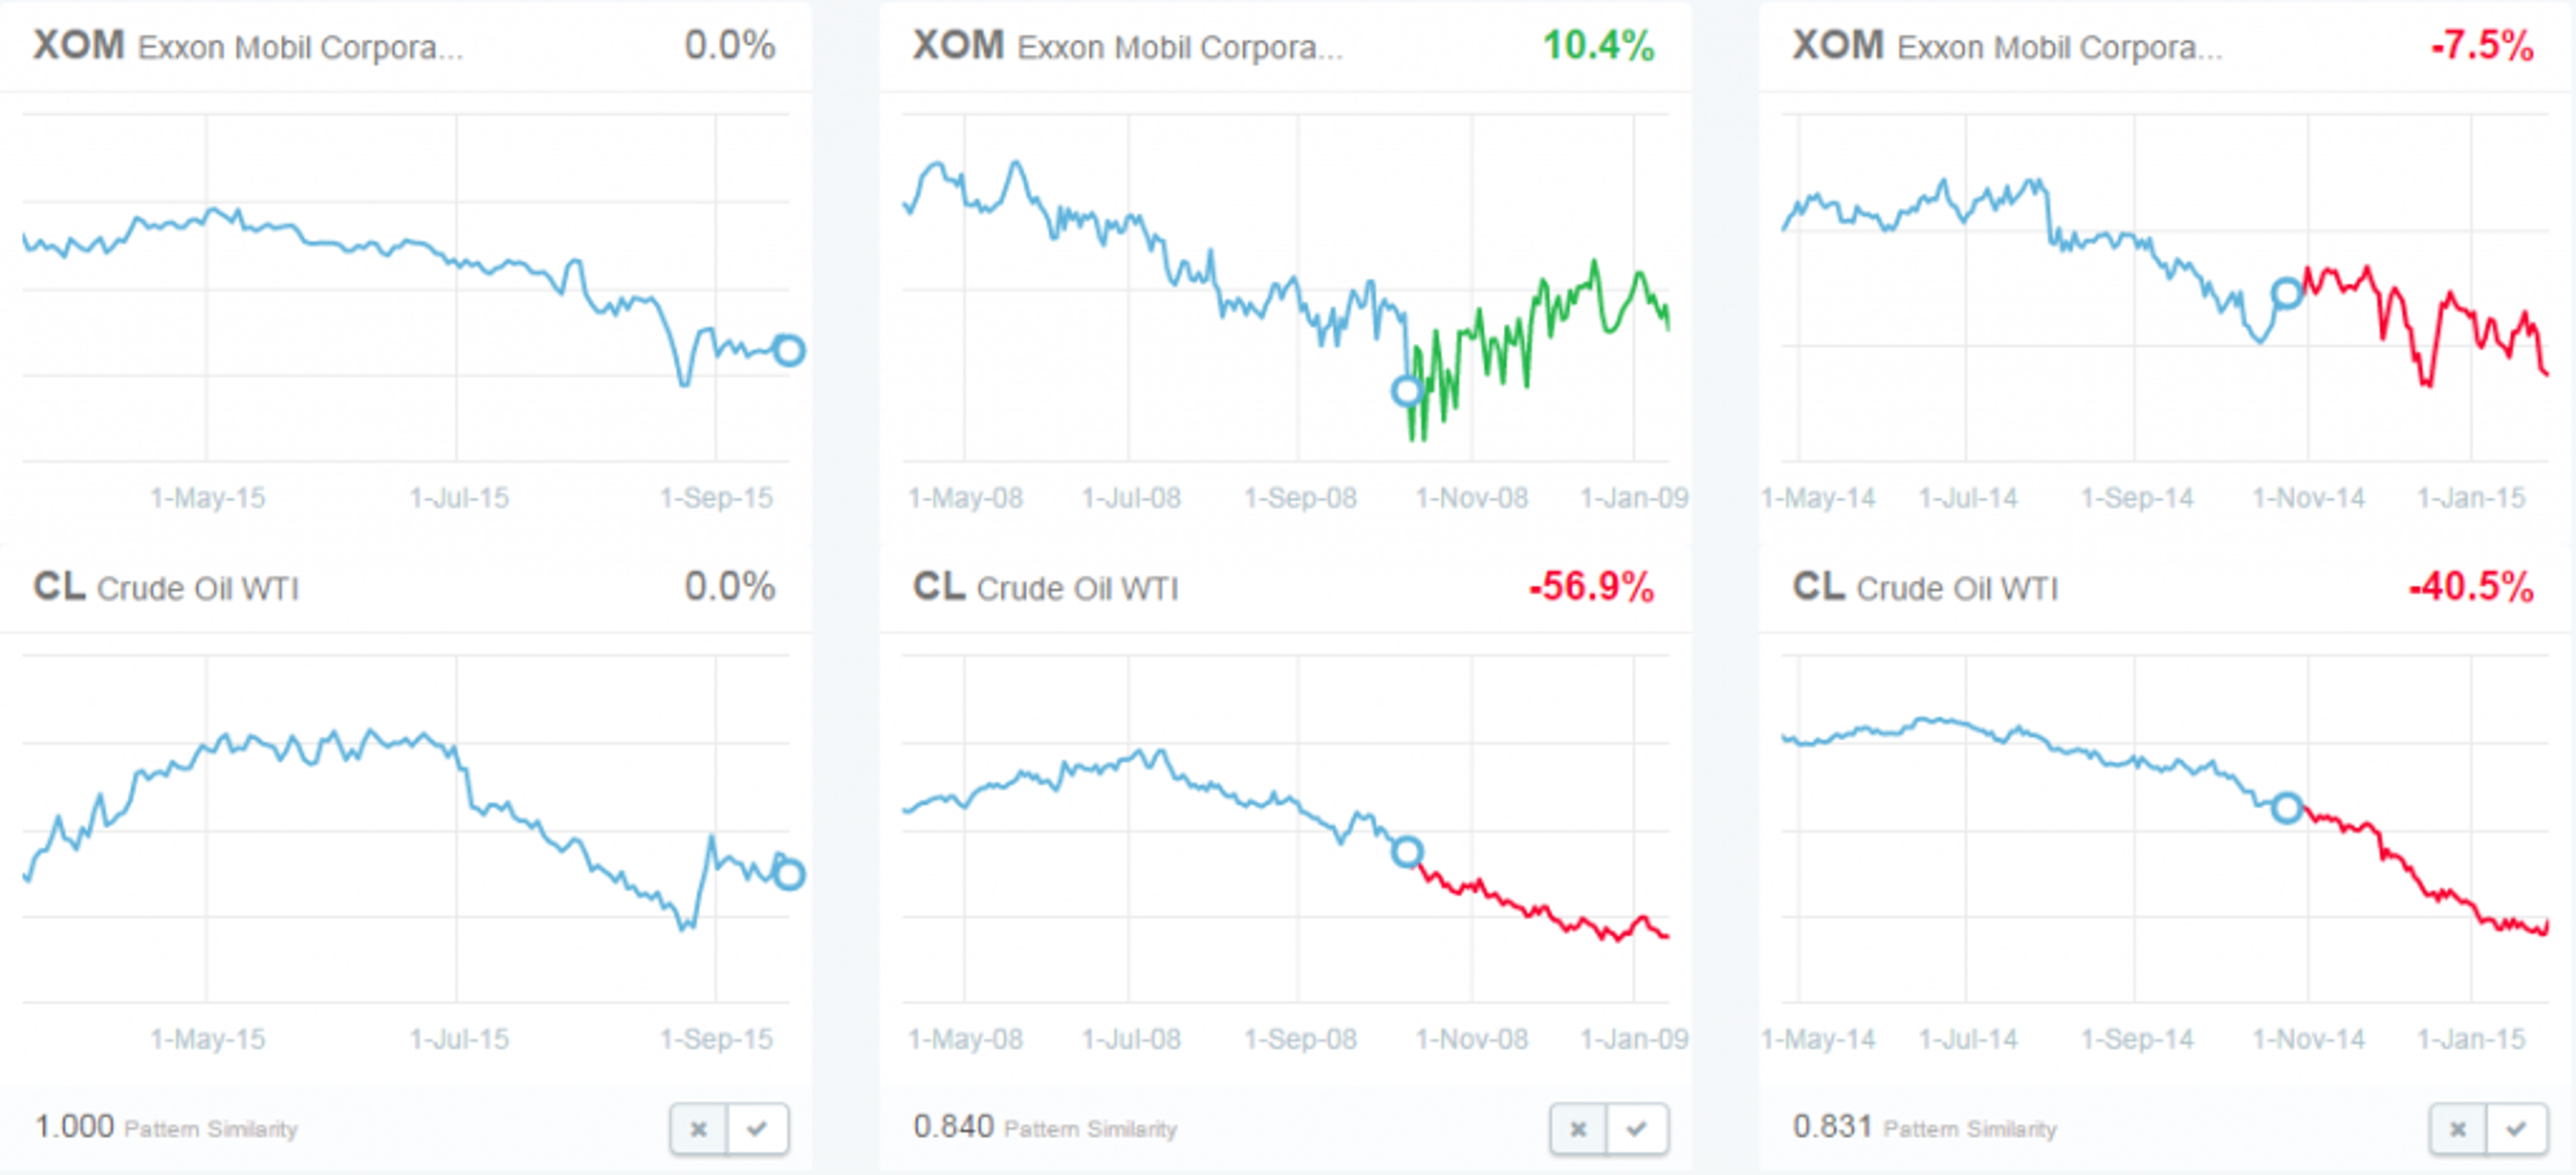
The chart below shows the current 6 month patterns for both XOM and CL (WTI), and the three month forward projection for the 5 matches. What’s interesting, that we’ll dive into further, is that while Crude on average continues down in these environments, Exxon Mobil on average rebounds.


Exxon Mobil holds steady when Crude prices continue to fall.
The two most similar matches (displayed below), from 2008 and 2014, are also the two worst performing periods for Crude WTI in the next 3 months. In both of these periods, Crude Oil WTI prices continued down aggressively to the tune of a -56.9% and -40.5% drop. However, Exxon Mobil actually rebounded in late 2008 ahead of the market turn (March of 2009) and was only down -7.5% last year (vs. the -40.5% for Crude).

Exxon Mobil is up 80% of the time in statistically similar environments.
The returns, and historical periods, for all 5 matches are plotted below. The grainy colored bars are the returns for Crude WTI in each period, and the returns for XOM are in block color.
One thing to highlight is that Exxon Mobil trades with much less volatility than Crude in each of these statistically similar environments. Again, it’s also compelling that with a major continued drop in Crude Oil prices from 2008 and 2014 you had less downside with XOM. In 2012, when prices stayed flat, XOM was up 10.4% in the next 3 months. And, in the two environments where Crude rebounded strongly, XOM was up about 11% on average.


© 2024 Benzinga.com. Benzinga does not provide investment advice. All rights reserved.
Trade confidently with insights and alerts from analyst ratings, free reports and breaking news that affects the stocks you care about.

