


The following stock has been highlighted by VantagePoint Software, an artificial intelligence platform that provides market forecasts 1-3 days in advance. For a free demo click here.
Shares of NVIDIA Corporation NVDA have been steadily rising in 2018, culminating in an all-time high of $292.76 on Tuesday.
But the stock has now fallen off 5 percent from that high, and the volatility experienced in the overall market on Thursday has investors on their toes. That said, let's take a look at where the stock is headed in the coming days, and whether NVDA's strong performance will continue
Downtrend Forecasted

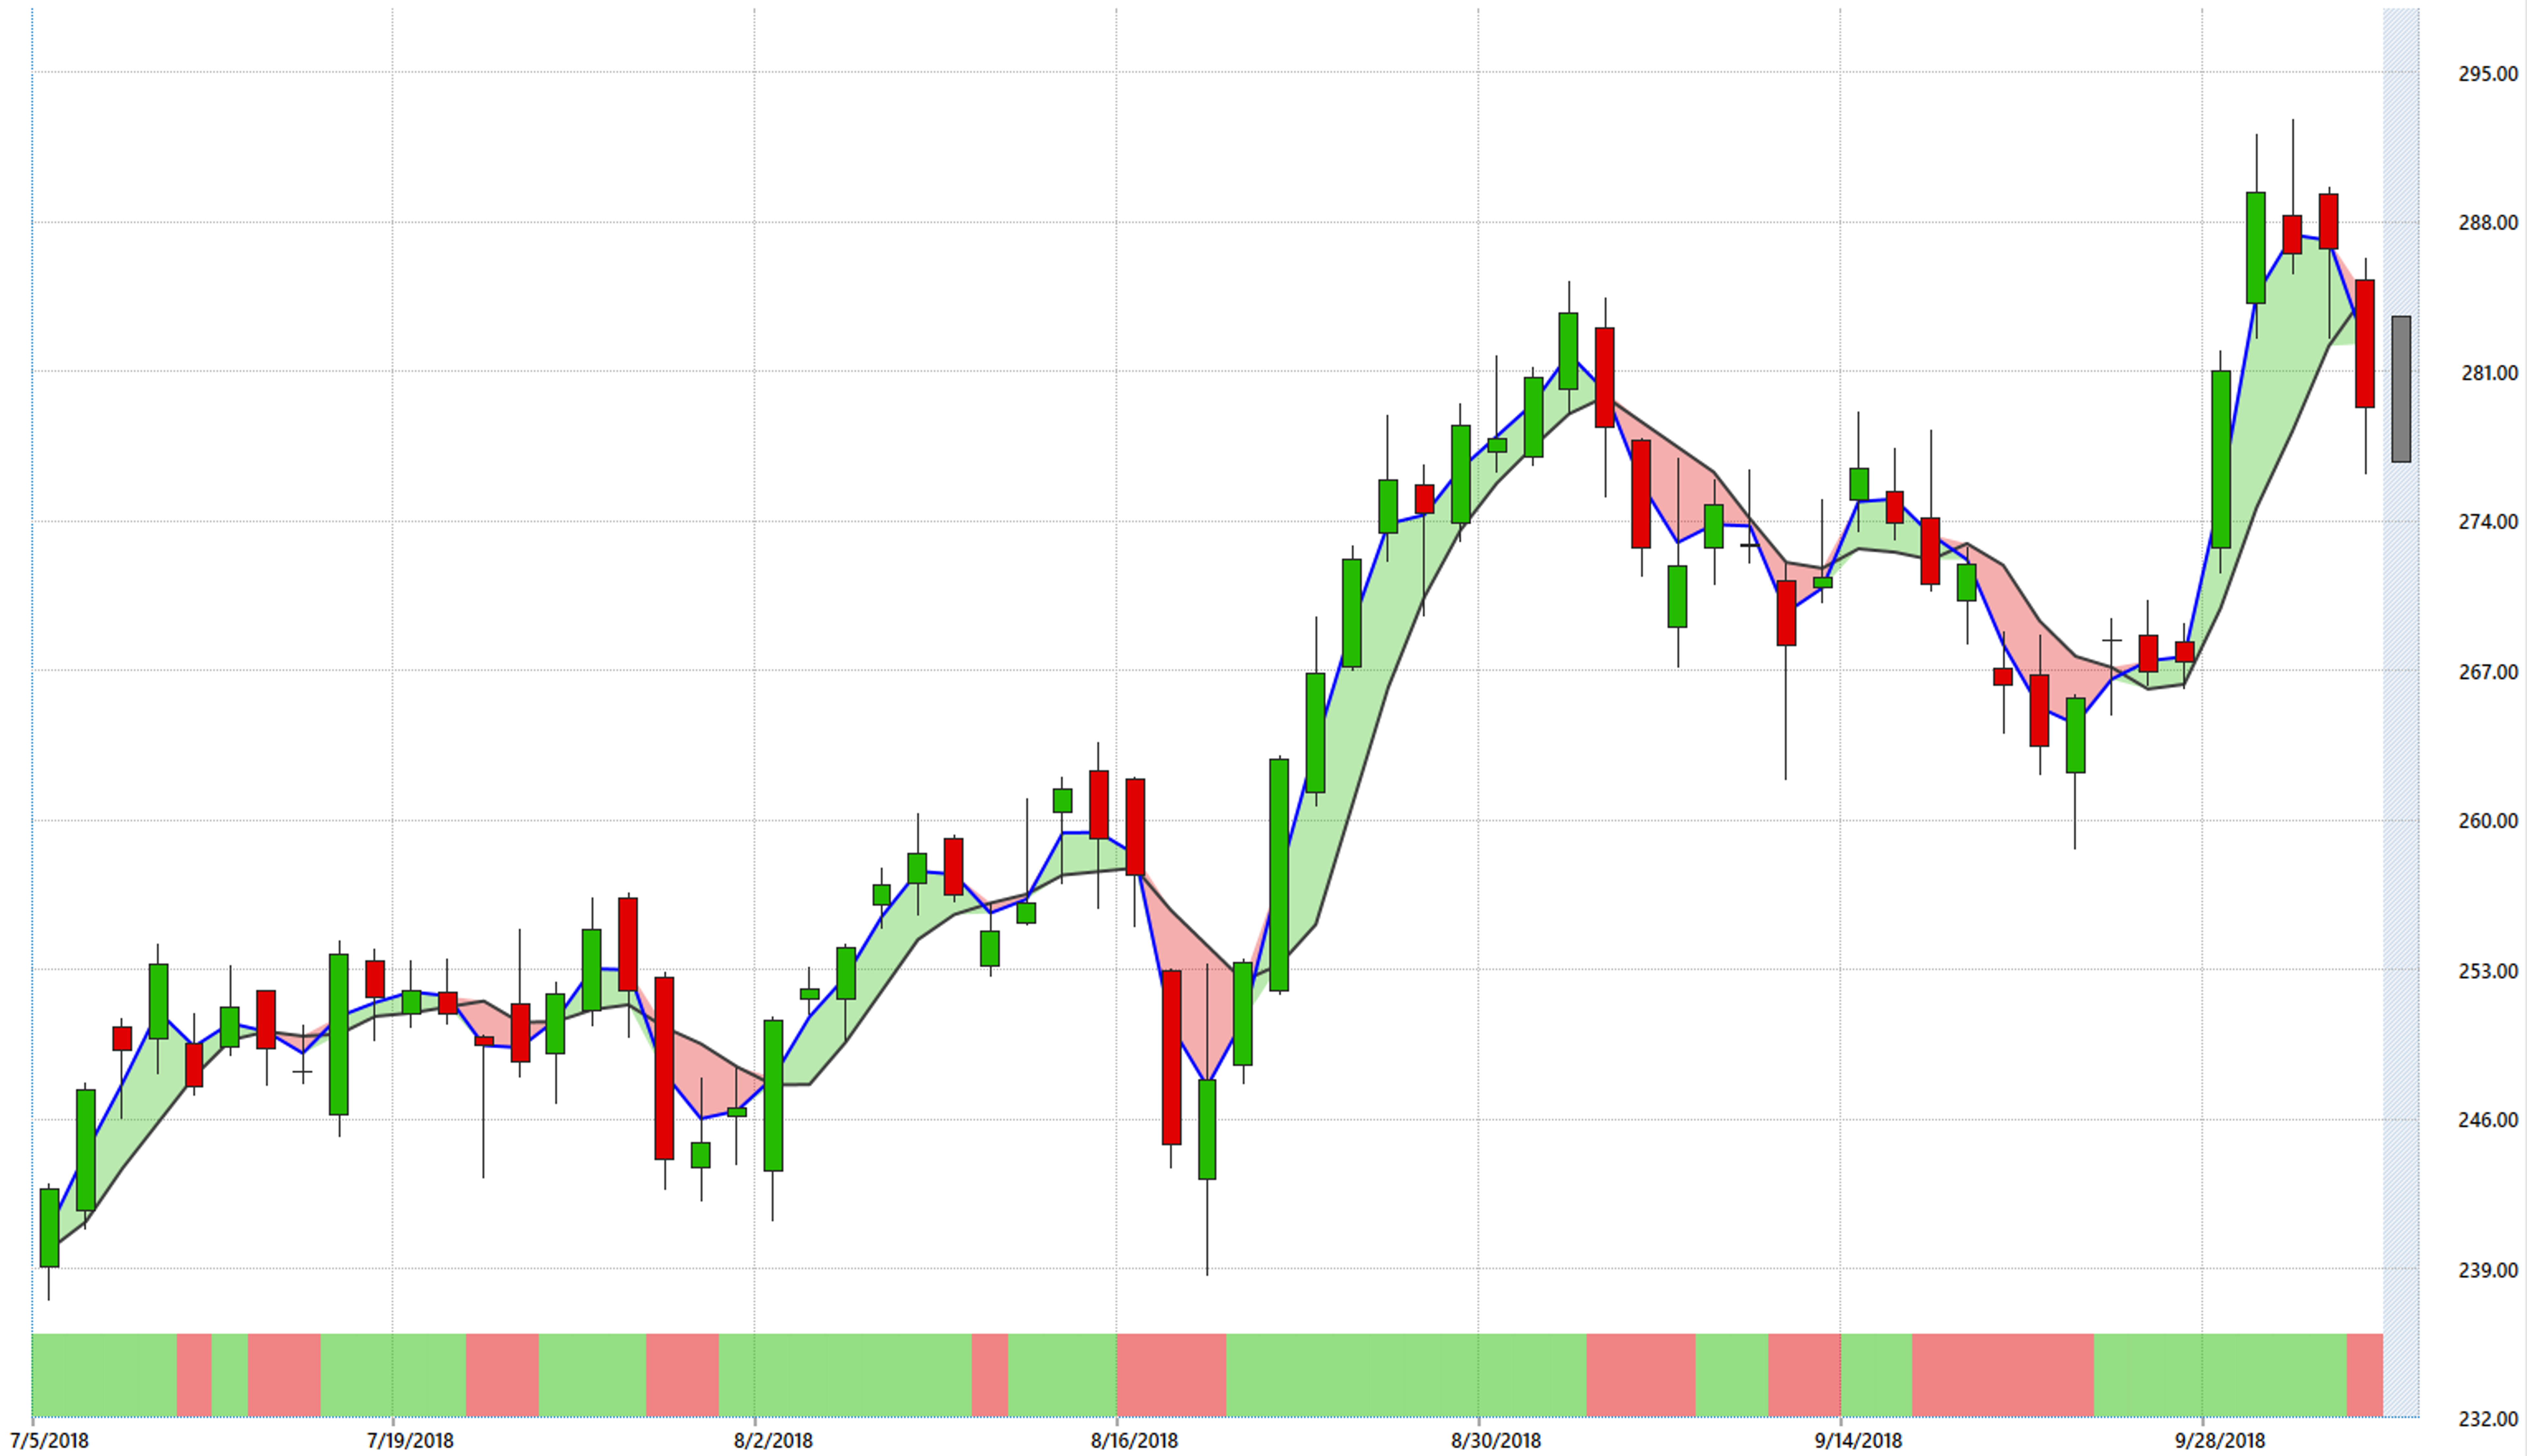
The predicted moving average, the blue line on the chart, signals an uptrend when it crosses above the black line, which is a simple 10-day average. You can see how an uptrend was signaled on Sept. 26, prior to the stock's breakout to all-time highs.
Notice what happened on Thursday—the moving averages crossed back over each other. We can take that as a signal that the stock may fall in the coming days.
The red-green bar at the bottom of the chart—the neural index—has shifted to red, which serves as a confirmation of this trend.
Shares of NVDA were trading down 1.5 percent on Friday morning.
VantagePoint Software is a content partner of Benzinga. To see what their indicators say about other stocks, futures, commodities or ETFs, or to get a free demo, click here.
© 2024 Benzinga.com. Benzinga does not provide investment advice. All rights reserved.
Trade confidently with insights and alerts from analyst ratings, free reports and breaking news that affects the stocks you care about.

