


The following stock has been highlighted by VantagePoint Software, an artificial intelligence platform that provides market forecasts 1-3 days in advance. For a free demo click here.
Shares of Medtronic PLC MDT have broken out in 2018. After struggling for two years to breach $90, MDT finally broke through in August thanks to the company's strong Q1 earnings report in which the company exceeded both EPS and sales estimates. Since that report on August 21 the stock is up over 7 percent.
But according to VantagePoint Software's two main indicators, a predicted moving average and predicted neural index, the stock's upward momentum has clearly halted.
The blue line on the chart below is a three-day predicted moving average, and the black is a simple 10-day moving average. The blue line staying above the black indicates a bullish trend, while a crossover indicates a bearish signal.

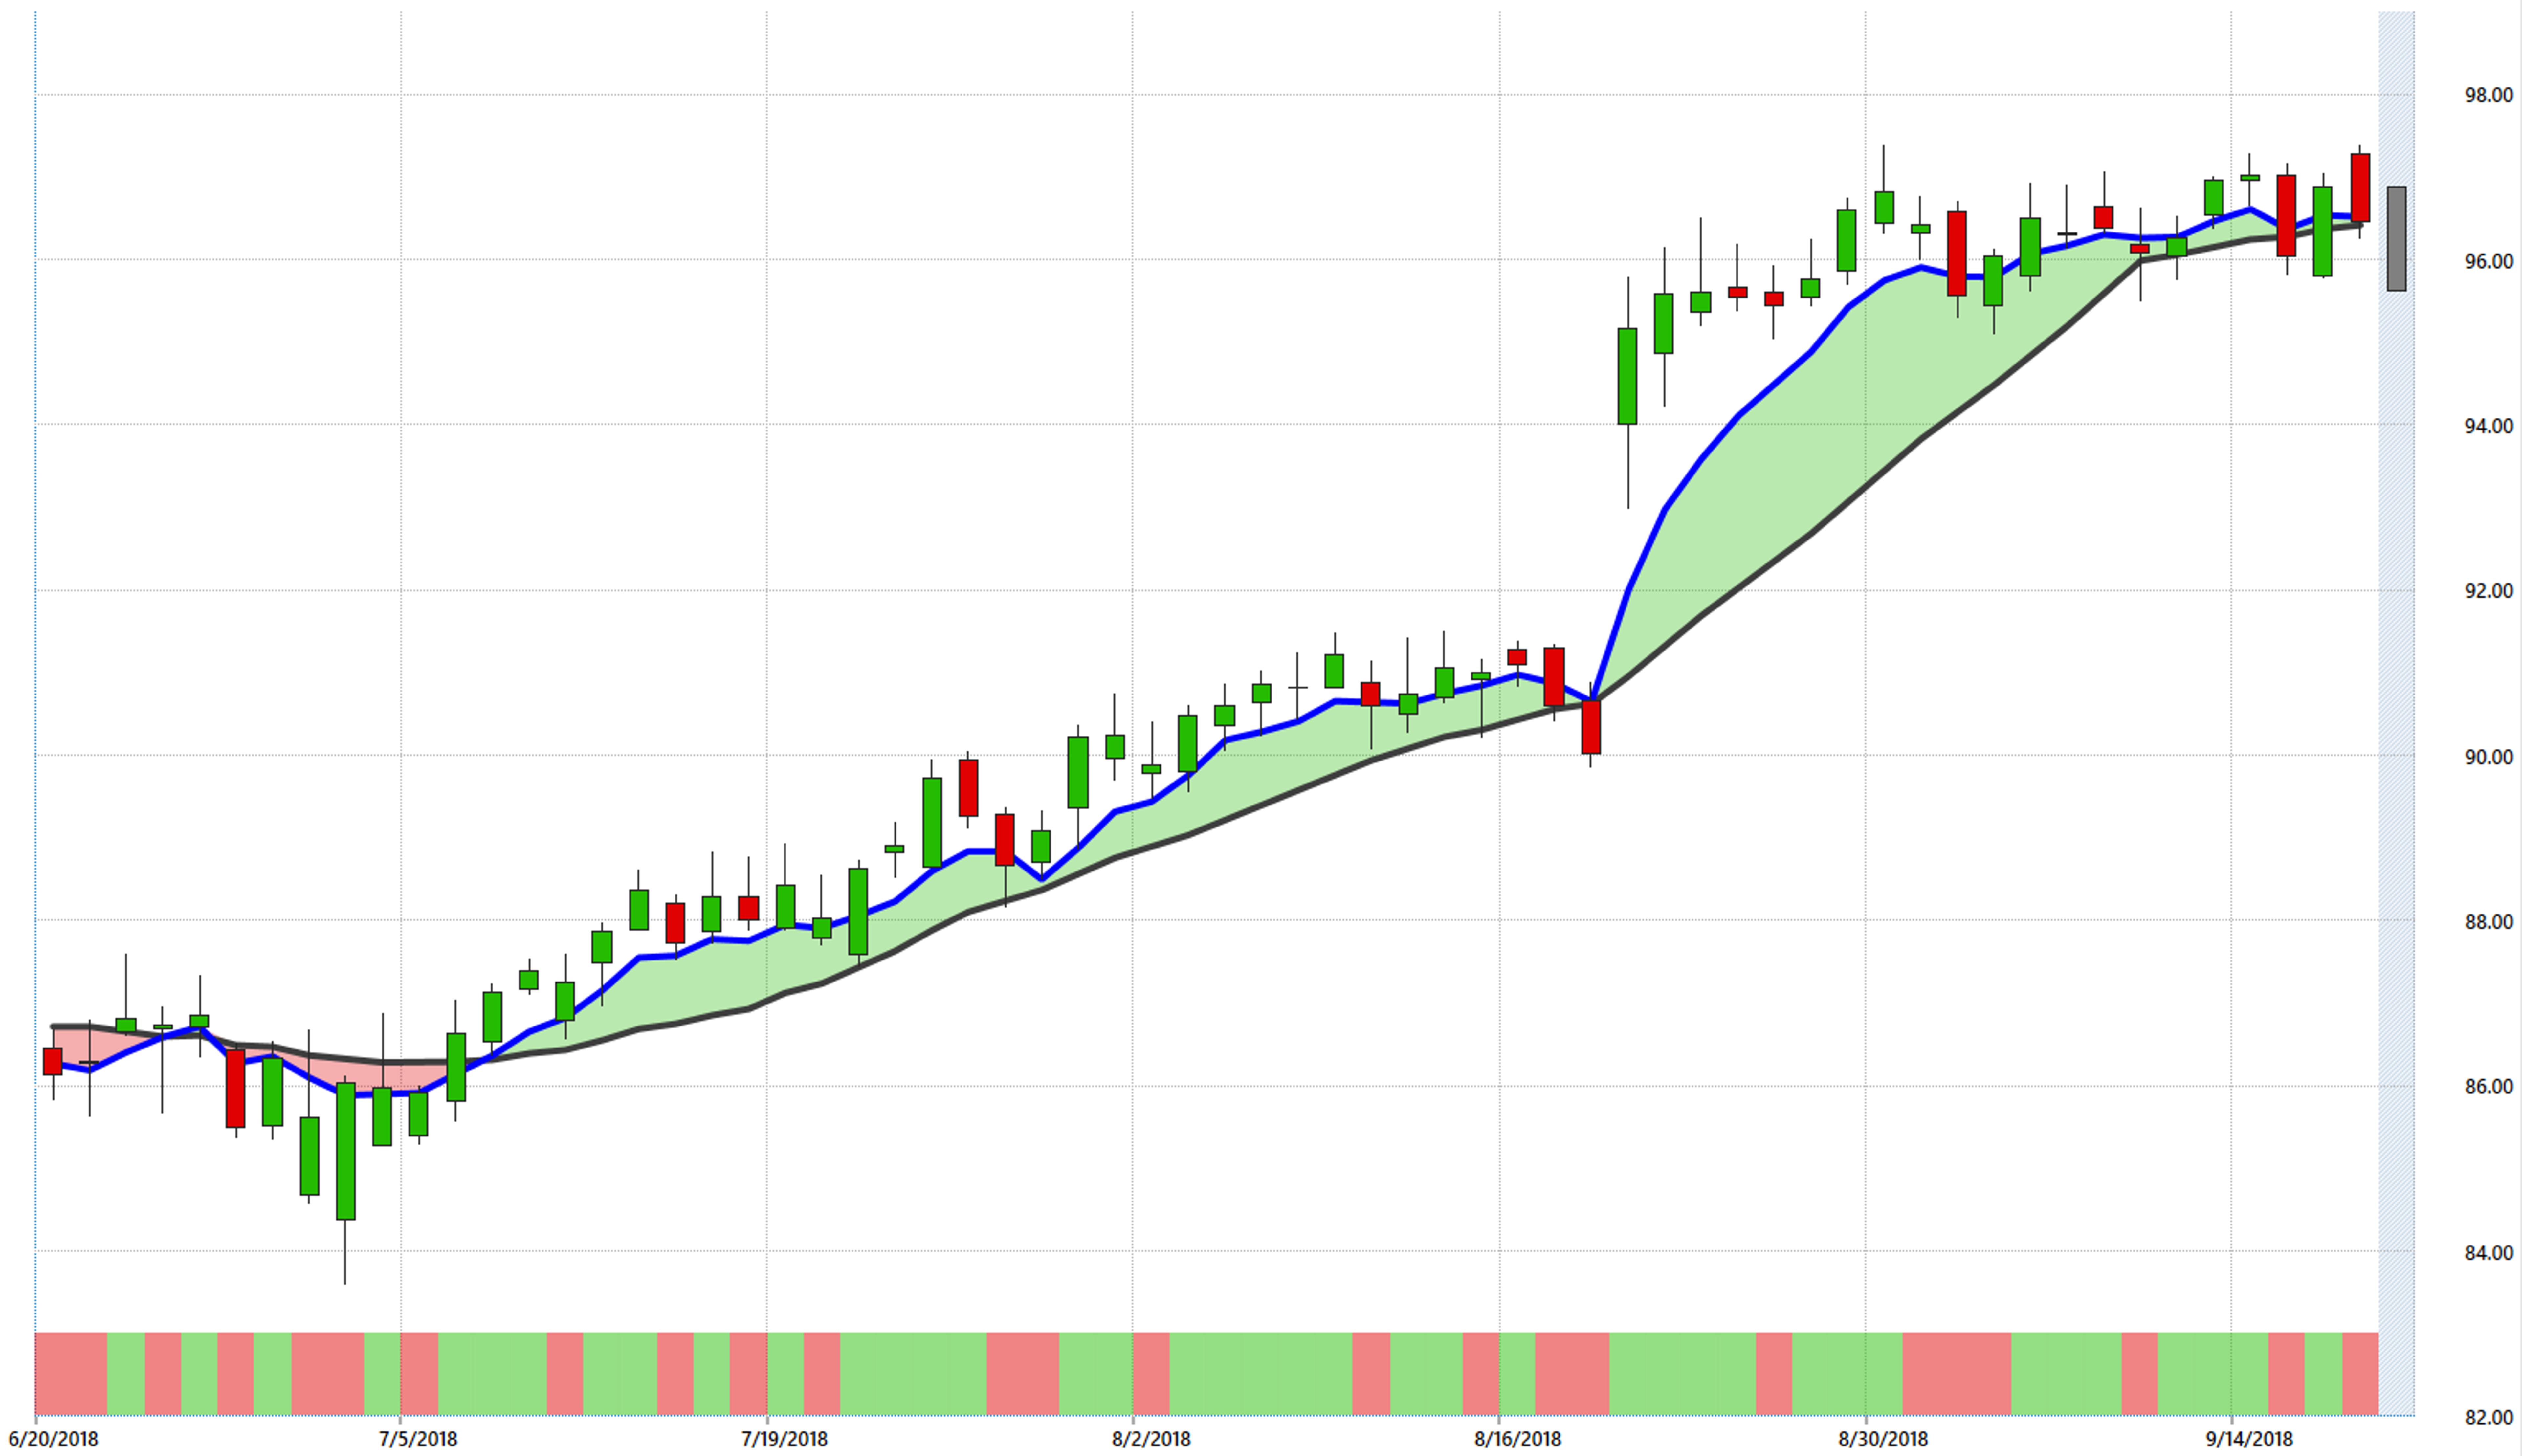
While the two lines have not fully crossed over yet, the convergence indicates that, at the very least, the top could be in for now. To go along with that, the red-green Neural Index at the bottom of the chart has turned red, indicating that there could be another down day coming in the next few days. MDT closed up $0.30 in Thursday's session.
VantagePoint Software is a content partner of Benzinga. To see what their indicators say about other stocks, futures, commodities or ETFs, or to get a free demo, click here.
© 2024 Benzinga.com. Benzinga does not provide investment advice. All rights reserved.
Trade confidently with insights and alerts from analyst ratings, free reports and breaking news that affects the stocks you care about.

