


Coinbase Global Inc COIN was trading almost 10% lower on Monday after receiving a downgrade from Goldman Sachs.
Goldman Sachs analyst Will Nance downgraded the stock from Neutral to Sell rating and lowered the price target from $70 to $45.
The downgrade is the second bearish analyst coverage the cryptocurrency platform has received recently. On June 23, Redburn Partners analyst Nicholas Watts downgraded Coinbase from a Buy rating to a Neutral rating.
Coinbase’s bearish reaction to the additional downgrade didn’t negate the uptrend the stock has been trading in since June 13.
An uptrend occurs when a stock consistently makes a series of higher highs and higher lows on the chart.
The higher highs indicate the bulls are in control while the intermittent higher lows indicate consolidation periods.
Traders can use moving averages to help identify an uptrend, with rising lower time frame moving averages (such as the eight-day or 21-day exponential moving averages) indicating the stock is in a steep shorter-term uptrend.
Rising longer-term moving averages (such as the 200-day simple moving average) indicate a long-term uptrend.
A stock often signals when the higher high is in by printing a reversal candlestick such as a doji, bearish engulfing or hanging man candlestick. Likewise, the higher low could be signaled when a doji, morning star or hammer candlestick is printed. Moreover, the higher highs and higher lows often take place at resistance and support levels.
In an uptrend the "trend is your friend" until it’s not and there are ways for both bullish and bearish traders to participate in the stock:
- Bullish traders who are already holding a position in a stock can feel confident the uptrend will continue unless the stock makes a lower low. Traders looking to take a position in a stock trading in an uptrend can usually find the safest entry on the higher low.
- Bearish traders can enter the trade on the higher high and exit on the pullback. These traders can also enter when the uptrend breaks and the stock makes a lower low indicating a reversal into a downtrend may be in the cards.
Want direct analysis? Find me in the BZ Pro lounge! Click here for a free trial.
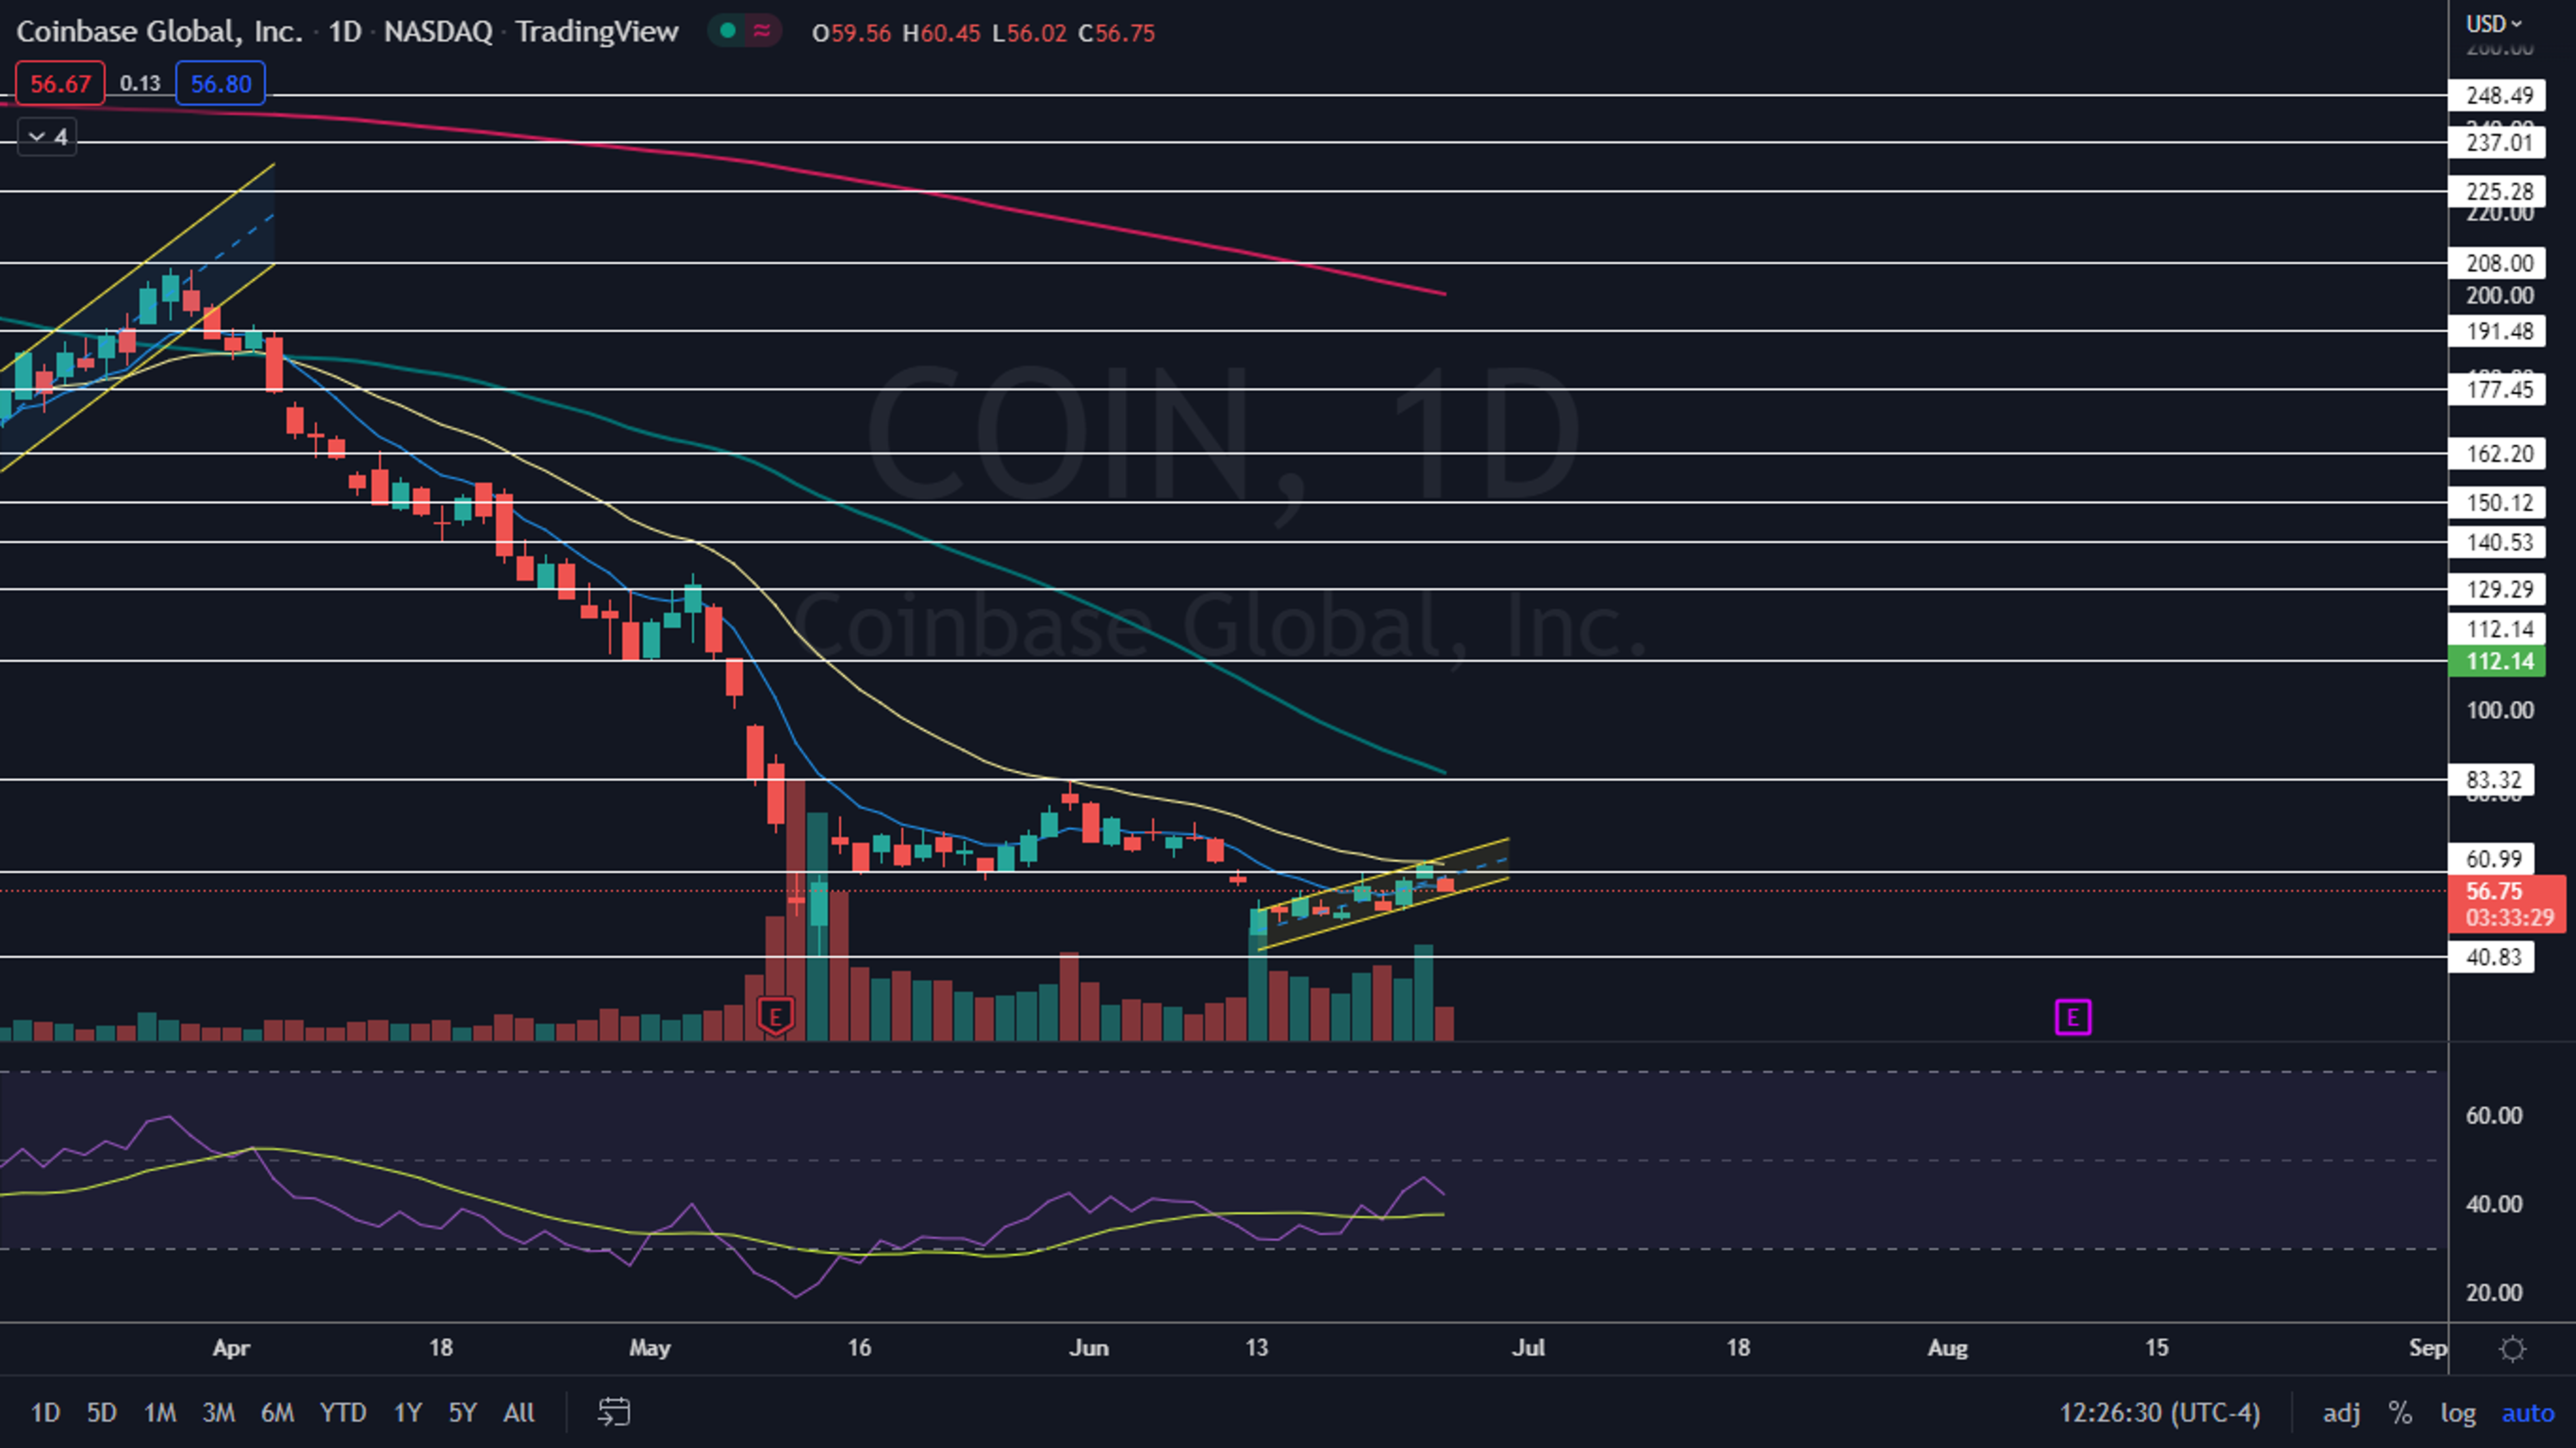
The Coinbase Chart: The most recent higher high in Coinbase’s uptrend was printed on Friday at $64.09 and the most recent confirmed higher low was formed at the $51.57 mark on June 22. As long as Coinbase remains above the most recent higher low on this current retracement, the uptrend will remain intact.
- Coinbase’s uptrend is taking place within a rising channel pattern, between two parallel lines. The pattern is considered to be bullish until a stock breaks down from the lower ascending trendline of the channel on higher-than-average volume on small timeframes. On Monday, Coinbase tested the lower trendline as support and wicked up from the area, which suggests the pattern is being recognized by the algorithms.
- Coinbase was trading lower on Monday on lower-than-average volume, which indicates consolidation as opposed to fear selling. At press time, about 8.3 million shares of Coinbase had exchanged hands compared to the 10-day average of 17.47 million.
- Bullish traders want to see Coinbase continue to hold above the lower trendline of the pattern and then for the stock to bounce up toward the upper trendline. If Coinbase can break up bullishly from the rising channel over the coming days, it will regain support at the eight-day and 21-day exponential moving averages, which would give bullish traders more confidence going forward.
- Bearish traders want to see big bearish volume come in and break Coinbase down from the rising channel, which could force the stock to retest support at the all-time low of $40.83.
- Coinbase has resistance above at $60.99 and $83.32 and under the all-time low, there is no further support in the form of price history.

© 2024 Benzinga.com. Benzinga does not provide investment advice. All rights reserved.
Trade confidently with insights and alerts from analyst ratings, free reports and breaking news that affects the stocks you care about.

