


American Airlines Group, Inc AAL was falling more than 2% on Tuesday after declining 20% between June 7 and Monday.
On Tuesday, the airline announced about 4,500 pilots at three of its regional carriers, Envoy, Piedmont and PSA airlines, would receive large pay increases, with new pilots starting at as much as $90 per hour. American, like many other airlines, has suffered a pilot shortage, causing many of its planes to sit parked, despite a huge demand for travel.
The deal, which was ratified without a vote due to huge support from American Airlines’ union executive board, means pilots early in their career will start with an annual salary of about $90,000 compared to just $18,000 per year a decade ago.
While the news may help American Airlines get more planes in the air, it didn’t impress Barclays analyst Brandon Oglenski, who on Tuesday morning maintained an Underweight rating on the stock and lowered the price target from $20 to $17. The lowered price target suggests about 30% upside potential for the stock.
American Airlines could bounce up to $16.73 and still remain in the downtrend that the stock has been trading in since May 27, when American Airlines printed a double top pattern at $18.21.
Want direct analysis? Find me in the BZ Pro lounge! Click here for a free trial.
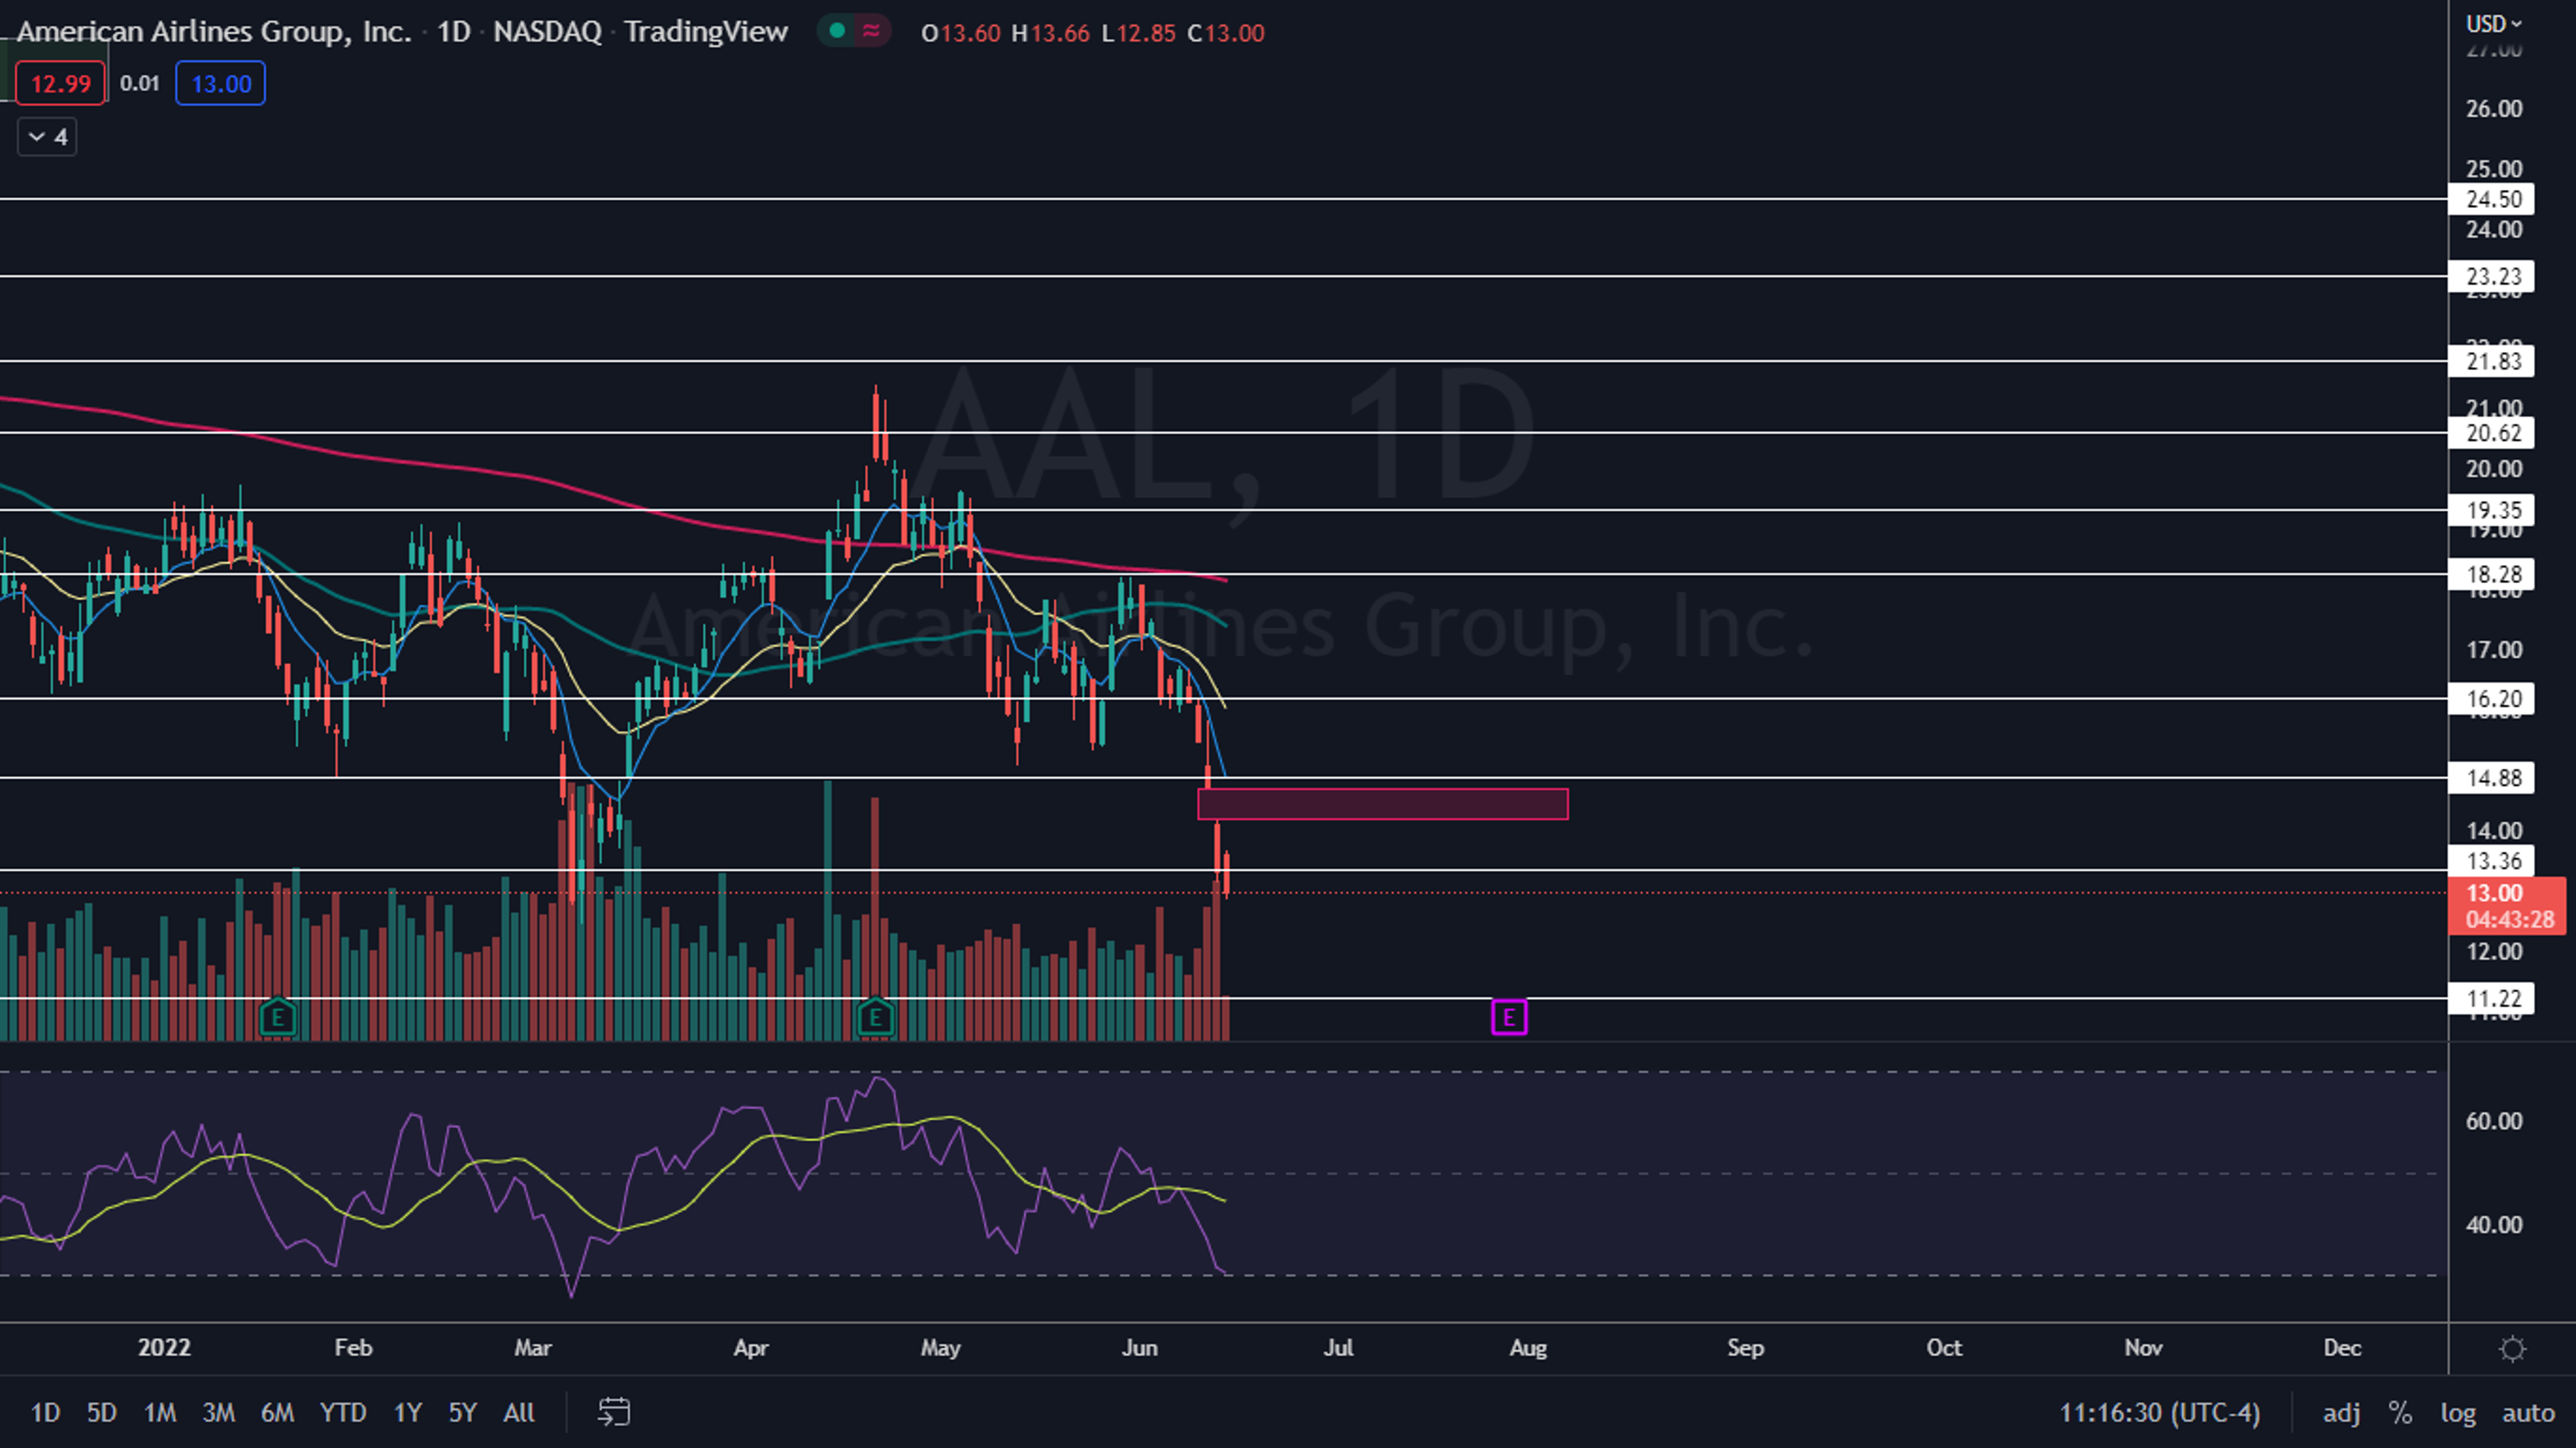
The American Airlines Chart: The double top pattern was printed on May 27 and May 31, which set American Airlines into a downtrend. The most recent lower high was formed on June 7 at $16.73 and the most recent lower low was created at the $15.96 level on that same day.
- On Tuesday, American Airlines opened slightly higher to start the trading day with an inside bar pattern but quickly broke down from Monday’s mother bar and briefly fell below the $13 mark. As of press time, bulls were attempting to buy the dip near $13 and if the bulls continue to defend that level as support, the stock may print a hammer candlestick on the daily chart, which could indicate a bounce is in the cards for Wednesday.
- A bounce is also likely to come because American Airlines’ relative strength index (RSI) reached about 30% on Tuesday. When a stock’s RSI reaches or falls below that level it becomes oversold, which can be a buy signal for technical traders. When the stock’s RSI fell to the 25% level on March 7, American Airlines rallied a whopping 66% between that date and April 21.
- Bearish traders will want to see American Airlines close the trading day below $13, which will cause the stock to print a bearish Marubozu candlestick and indicate lower prices are likely to come on Wednesday. If that happens, the bounce may not come until later in the week.
- American Airlines has resistance above at $13.36 and $14.88 and support below at $11.22 and $9.90.

See Also: 10 Biggest Price Target Changes For Tuesday
Photo: Edu Perez via Shutterstock
© 2024 Benzinga.com. Benzinga does not provide investment advice. All rights reserved.
Trade confidently with insights and alerts from analyst ratings, free reports and breaking news that affects the stocks you care about.

