


The SPDR S&P 500 SPY opened higher on Thursday and was rallying about 1% intraday on hopes the Federal Reserve will begin to cut interest rates later this year after raising the benchmark interest rate by 0.25% on Wednesday.
Following a two-day meeting, the Fed applied its second quarter point rate hike since raising interest rates by 0.5% in December. The December rate hike followed four consecutive 0.75% rate hikes.
While a 0.25% hike was the most likely scenario, some feared that data released in March, indicating the economy remains strong, could force the central bank to raise rates by 0.5%. Others believed the recent collapse of several financial institutions could tie the Fed’s hands and force the central bank to hold rates unchanged.
Although the Fed reiterated its goal to drop inflation down to 2%, chairman Jerome Powell’s tone turned less hawkish, indicating that the committee is likely to pause on raising rates when it meets next on May 2 and May 3.
The bearish reaction to FOMC on Wednesday caused the SPY to drop to test support at the 200-day simple moving average (SMA), and the lower ascending trendline of a rising channel pattern. The bounce higher on Thursday was the most likely scenario from a technical analysis perspective, because both the 200-day and the bottom of a pattern act as solid support.
Want direct analysis? Find me in the BZ Pro lounge! Click here for a free trial.
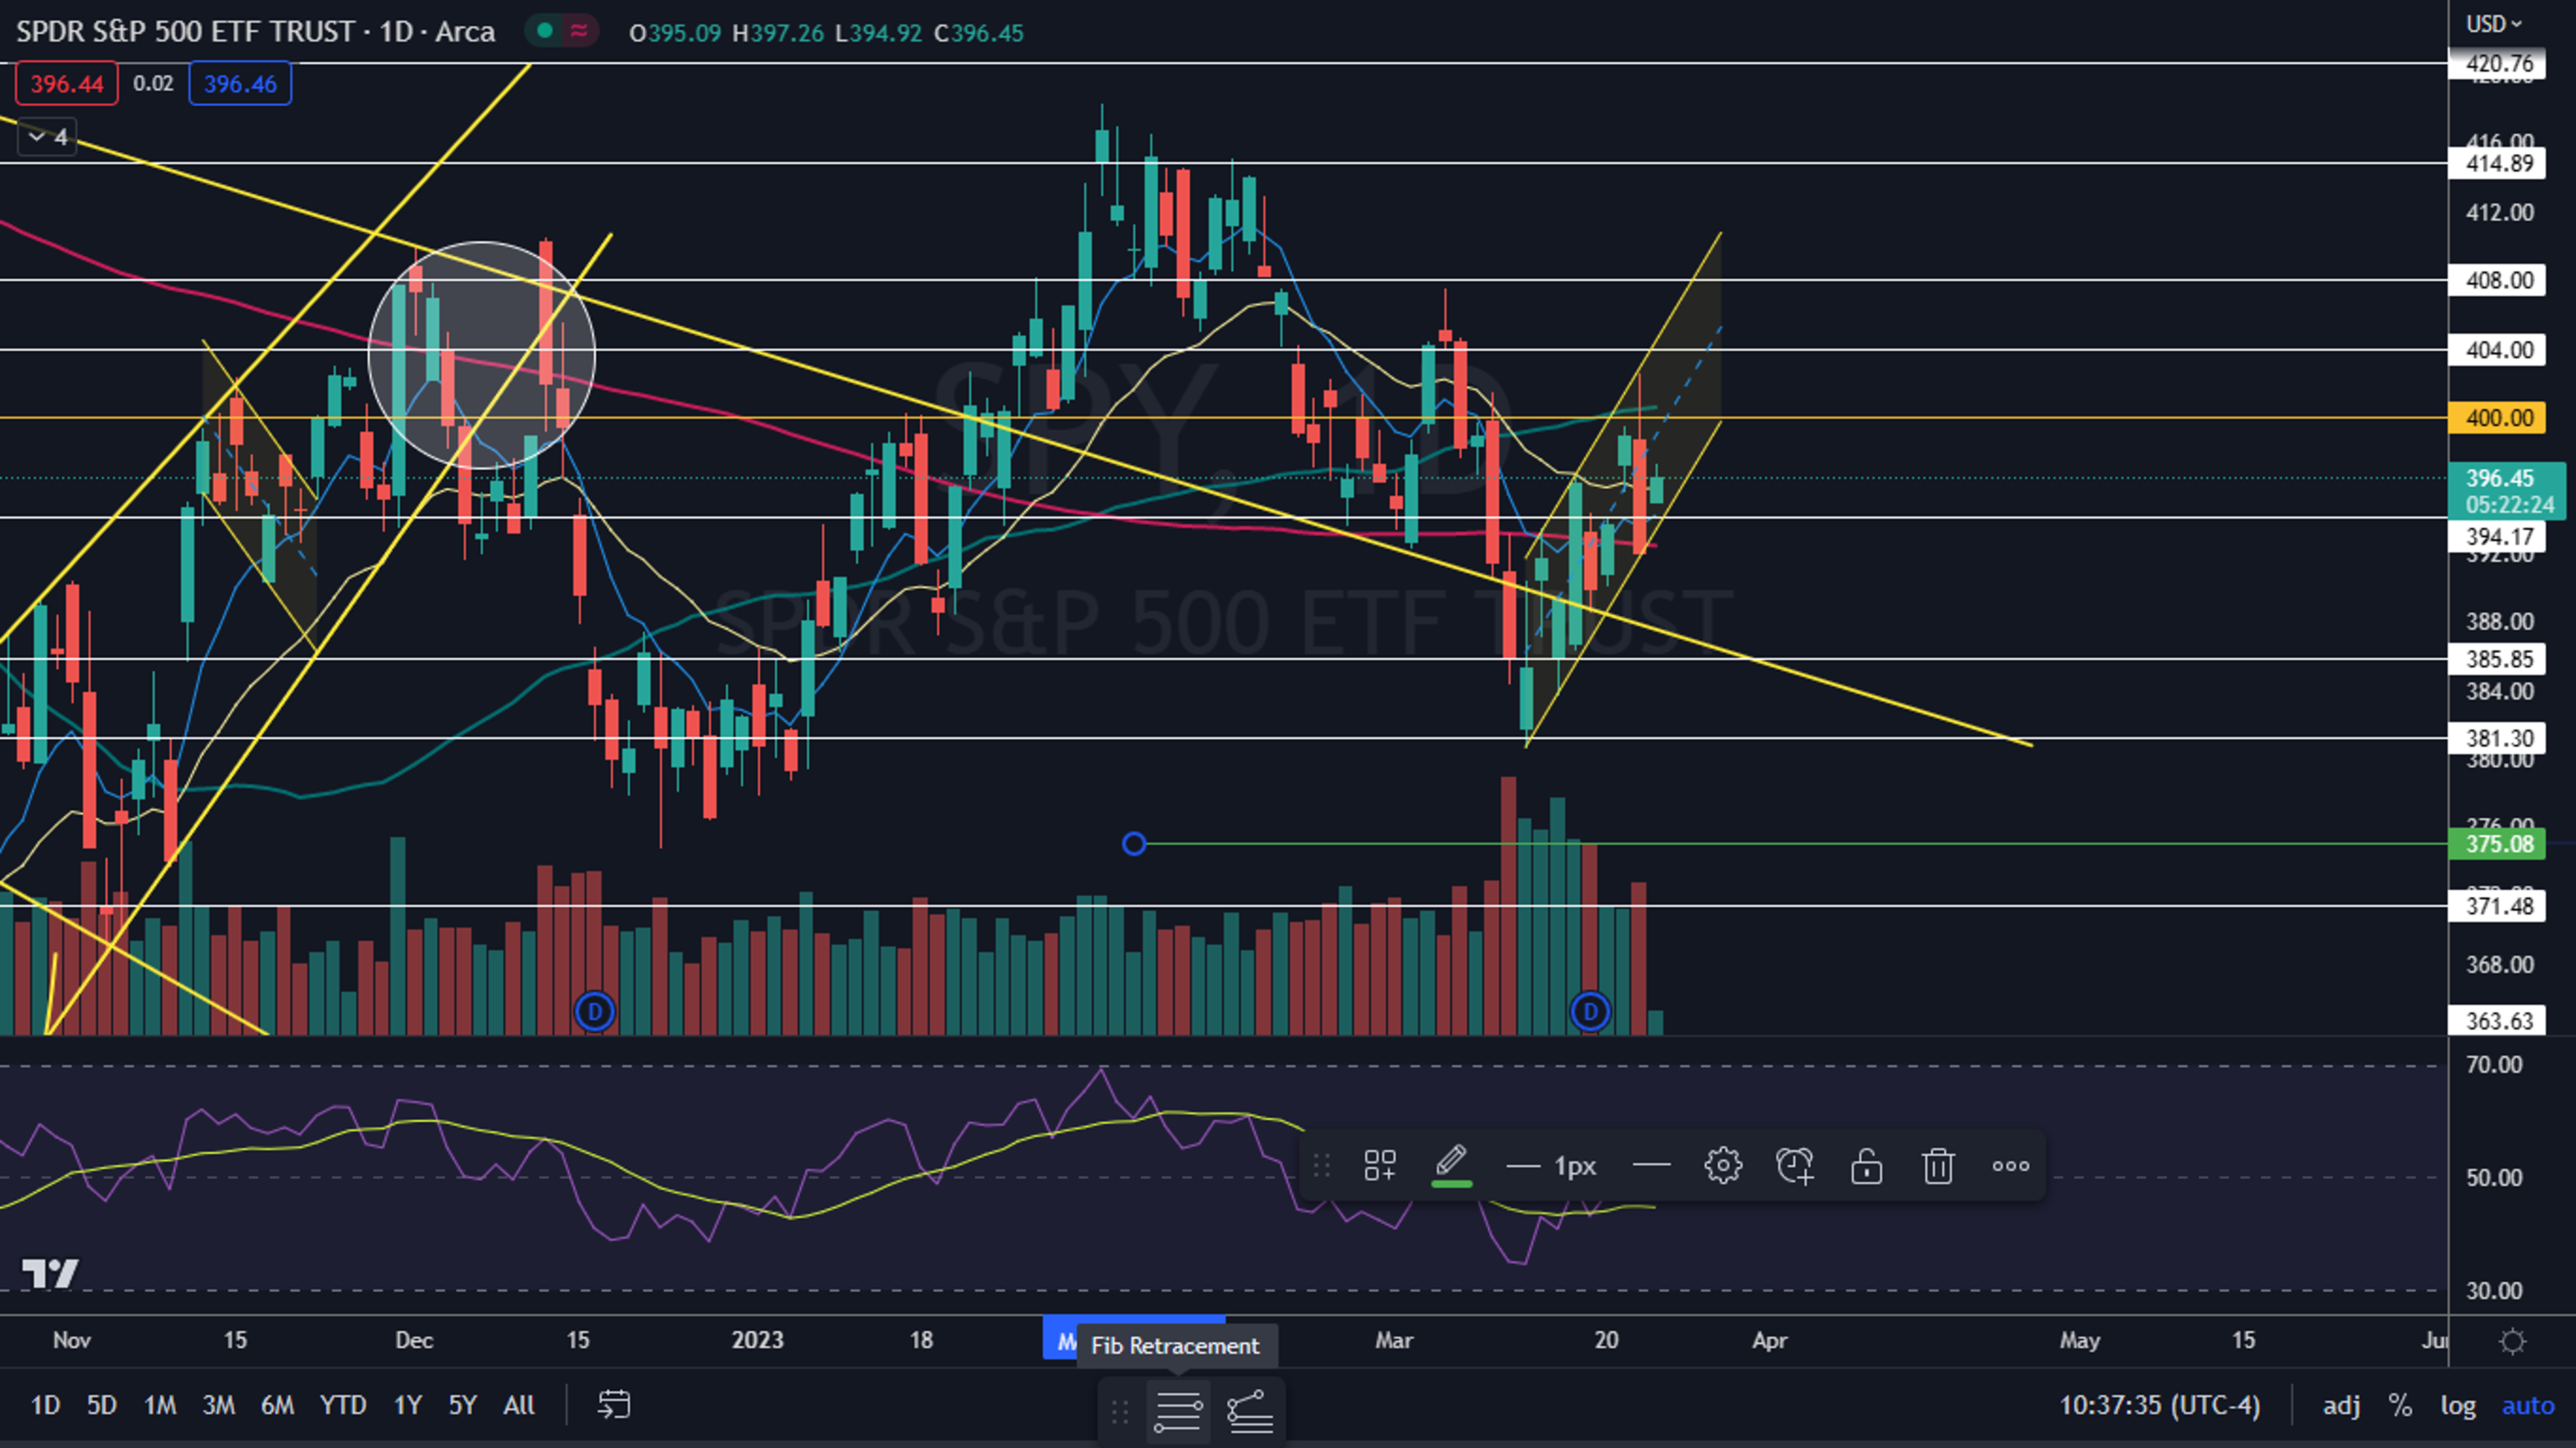
The SPY Chart: The SPY has been trading in an uptrend within a rising channel pattern since March 13, making a consistent series of higher highs and higher lows. The ETF’s most recent higher high was formed on Wednesday at $402.49 and the most recent higher low was printed at the $392.07 mark on the same day.
- The rising channel pattern is considered bullish until a stock or ETF breaks down from the lower trendline of the pattern on higher-than-average volume. If that happens, in can indicate a longer-term reversal to the downside is in the cards.
- On Thursday, the SPY was also printing an inside bar pattern, with all of the price action taking place within Wednesday’s trading range. The pattern leans bullish in this case but traders and investors can watch for the SPY to break up or down from Wednesday’s mother bar on higher-than-average volume later on Thursday or over the next few days, to gauge future direction.
- The SPY has resistance above at $400 and $404 and support below at $394.17 and $385.85.

© 2024 Benzinga.com. Benzinga does not provide investment advice. All rights reserved.
Trade confidently with insights and alerts from analyst ratings, free reports and breaking news that affects the stocks you care about.

