


Apple, Inc AAPL was slipping slightly in the premarket on Tuesday after consolidating lower on Monday.
When the tech giant printed its fiscal fourth-quarter earnings miss on Feb. 2, the stock dropped the following morning to test support at the 200-day simple moving average (SMA). When the stock held above the level, buyers swarmed in to buy the dip, causing Apple to surge 4.5% off the low of day.
The sharp increase in Apple’s price on the day post earnings made subsequent consolidation the most likely scenario and on Monday the consolidation took the form of an inside bar pattern.
See Also: If You Bought $1,000 In Apple Stock When The iPod Was Released, Here's How Much You'd Have Now
An inside bar pattern indicates a period of consolidation and is usually followed by a continuation move in the direction of the current trend.
An inside bar pattern has more validity on larger time frames (four-hour chart or larger). The pattern has a minimum of two candlesticks and consists of a mother bar (the first candlestick in the pattern) followed by one or more subsequent candles. The subsequent candle(s) must be completely inside the range of the mother bar and each is called an "inside bar."
A double, or triple inside bar can be more powerful than a single inside bar. After the break of an inside bar pattern, traders want to watch for high volume for confirmation the pattern was recognized.
- Bullish traders will want to search for inside bar patterns on stocks that are in an uptrend. Some traders may take a position during the inside bar prior to the break while other aggressive traders will take a position after the break of the pattern.
- For bearish traders, finding an inside bar pattern on a stock that's in a downtrend will be key. Like bullish traders, bears have two options of where to take a position to play the break of the pattern. For bearish traders, the pattern is invalidated if the stock rises above the highest range of the mother candle.
Want direct analysis? Find me in the BZ Pro lounge! Click here for a free trial.
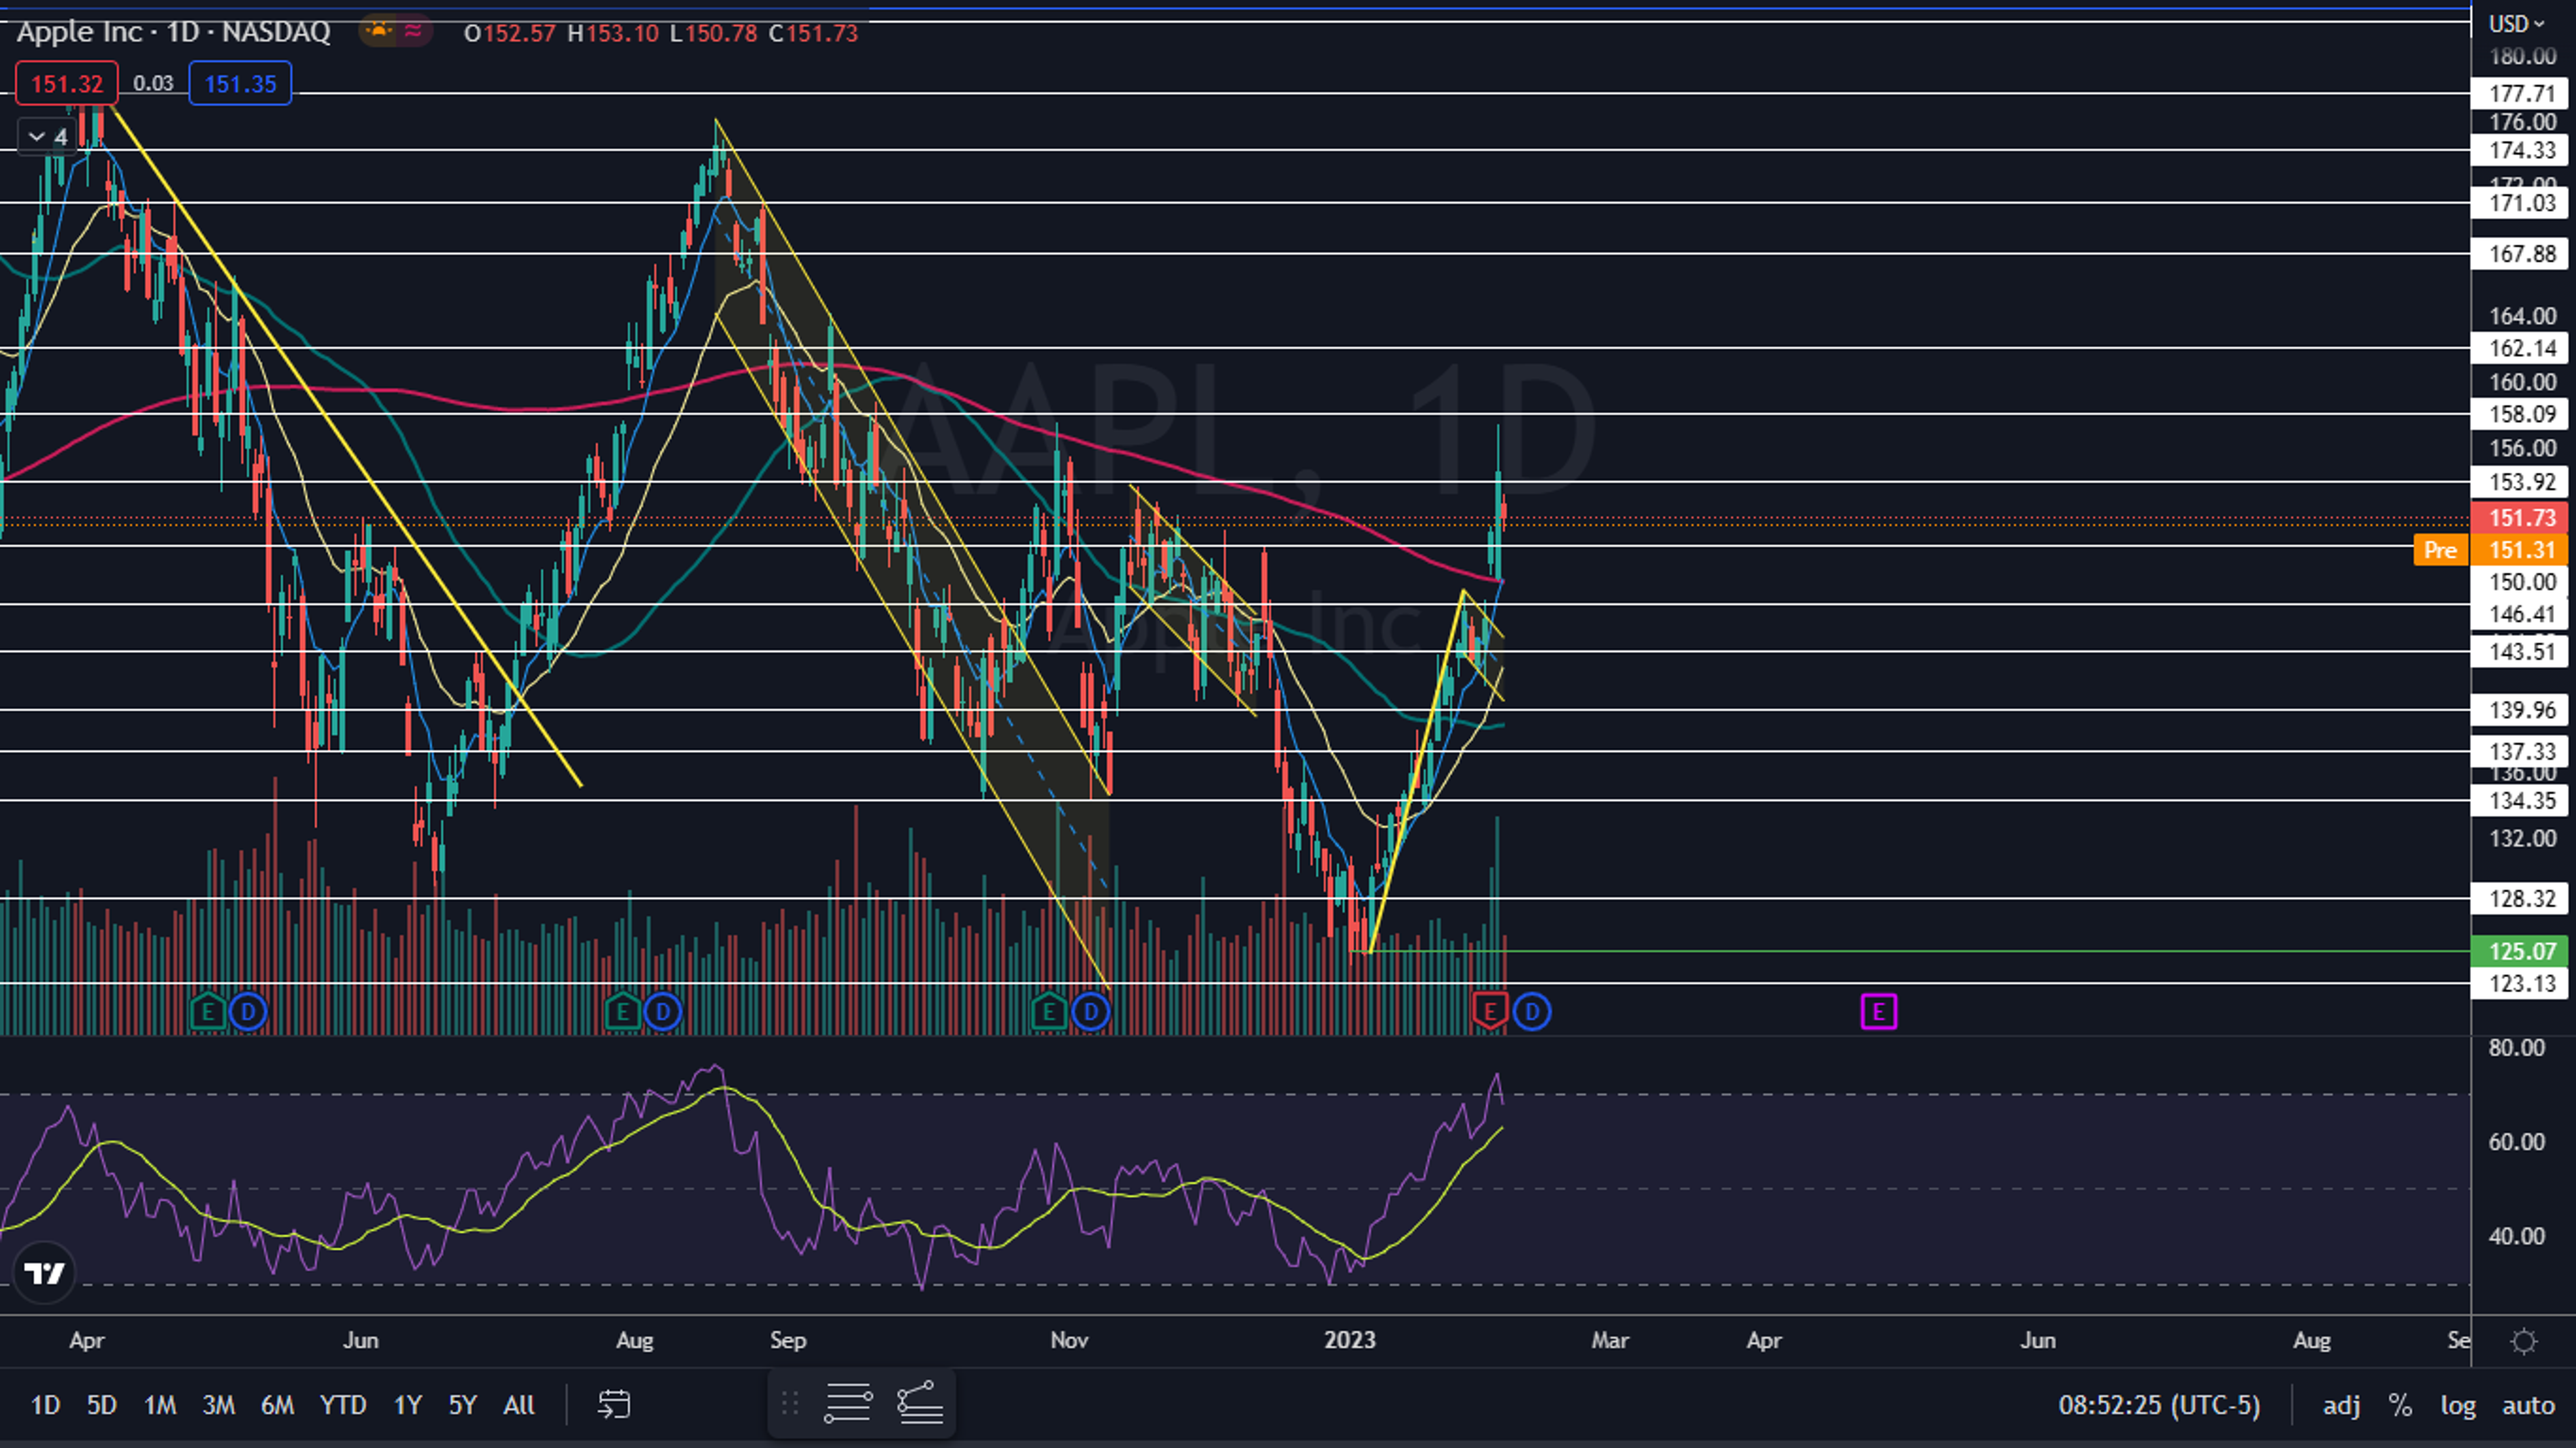
The Apple Chart: On the day of Apple’s earnings print, the stock gapped up from a bull flag pattern to regain the 200-day SMA as support. The back test of the 200-day on Friday was healthy and consolidation above the area may give bullish traders more confidence.
The measured move of the bull flag pattern is about 18%, which suggests that Apple could eventually rally up to about $167 but it should be noted that pullbacks for the stock to print higher lows along the way are likely to take place. If Apple eventually prints a lower high or a lower low to negate its uptrend or falls under the 200-day, the measured move will no longer be in play.
- Apple started trading in an uptrend on Jan. 6 and has made a consistent series of higher highs and higher lows. Apple’s most recent higher high was formed on Friday at $157.38 and the most recent higher low was printed at the $141.32 mark on Feb. 1.
- On Monday, Apple printed a small inside bar within the upper half of Friday’s trading range. The inside bar leans bullish in this case because Apple was trading higher before forming the pattern.
- Traders and investors can watch for Apple to eventually break up or down from Friday’s mother bar on higher-than-average volume to gauge the future direction. There’s a possibility the stock will continue to trade within Friday’s range for a period of time, printing a double or even triple inside bar before a break occurs.
- Apple has resistance above at $153.92 and $158.09 and support below at $150 and $146.41.

© 2024 Benzinga.com. Benzinga does not provide investment advice. All rights reserved.
Trade confidently with insights and alerts from analyst ratings, free reports and breaking news that affects the stocks you care about.

