


The Direxion Daily S&P Oil & Gas Exp & Prod Bear 2X Shares DRIP was surging Monday after the Group of Seven (G7) nations and the European Union agreed to put a price cap of $60-per-barrel on Russian crude oil.
The news could have been bullish for North America-based oil and gas producers, but the sector is cyclical. After enjoying a long-term bull run that began in October 2020, many leaders in the market appear to have reached their peak.
Demand may also be waning globally, and although China has reportedly lifted some COVID restrictions, continued lockdowns are hampering travel.
DRIP is a double-leveraged fund designed to outperform the inverse movement of companies held in the S&P Oil & Gas Exploration & Production Select Industry Index.
A few of the most popular companies held in the ETF are Exxon Mobil Corp XOM, which is weighted at 1.26% within the ETF; Occidental Petroleum Corporation (NYSE OXY), weighted at 1.15%; and Marathon Oil Corporation MRO, weighted at 1.25%.
It should be noted that leveraged ETFs are meant to be used as a trading vehicle as opposed to long-term investments.
For traders looking to play the oil and gas sector bullishly, Direxion offers the Direxion Daily S&P Oil & Gas Exp & Prod Bull 2X Shares GUSH.
Want direct analysis? Find me in the BZ Pro lounge! Click here for a free trial.
The DRIP Chart: DRIP reversed into an uptrend on Nov. 16 and has since made a consistent series of higher highs and higher lows. DRIP’s most recent higher low was formed on Dec. 1 at $11.45 and the most recent confirmed higher high was printed at the $12.43 mark the day prior.
- The inverse ETF has also formed a rounded bottom pattern, which could eventually turn into a cup-and-handle pattern on the daily chart. Bullish traders looking to take a position can watch to see if DRIP eventually retraces into a short downtrend before reaching the left tip of the cup, which was formed on Oct. 11 at $15.77.
- DRIP regained the 50-day simple moving average (SMA) on Monday, which indicates longer-term sentiment has turned bullish. If the ETF closes the trading day near its high-of-day price, DRIP will print a bullish engulfing candlestick, which could indicate continuation to the upside is in the cards.
- The move higher was made on higher-than-average volume, which indicates there’s an increased level of interest in the ETF. As of Monday afternoon, DRIP’s volume was measuring in at about 6.6 million compared to the 10-day average of just over 5 million.
- DRIP has resistance above at $14.74 and $16.49 and support below at $13.42 and $11.93.

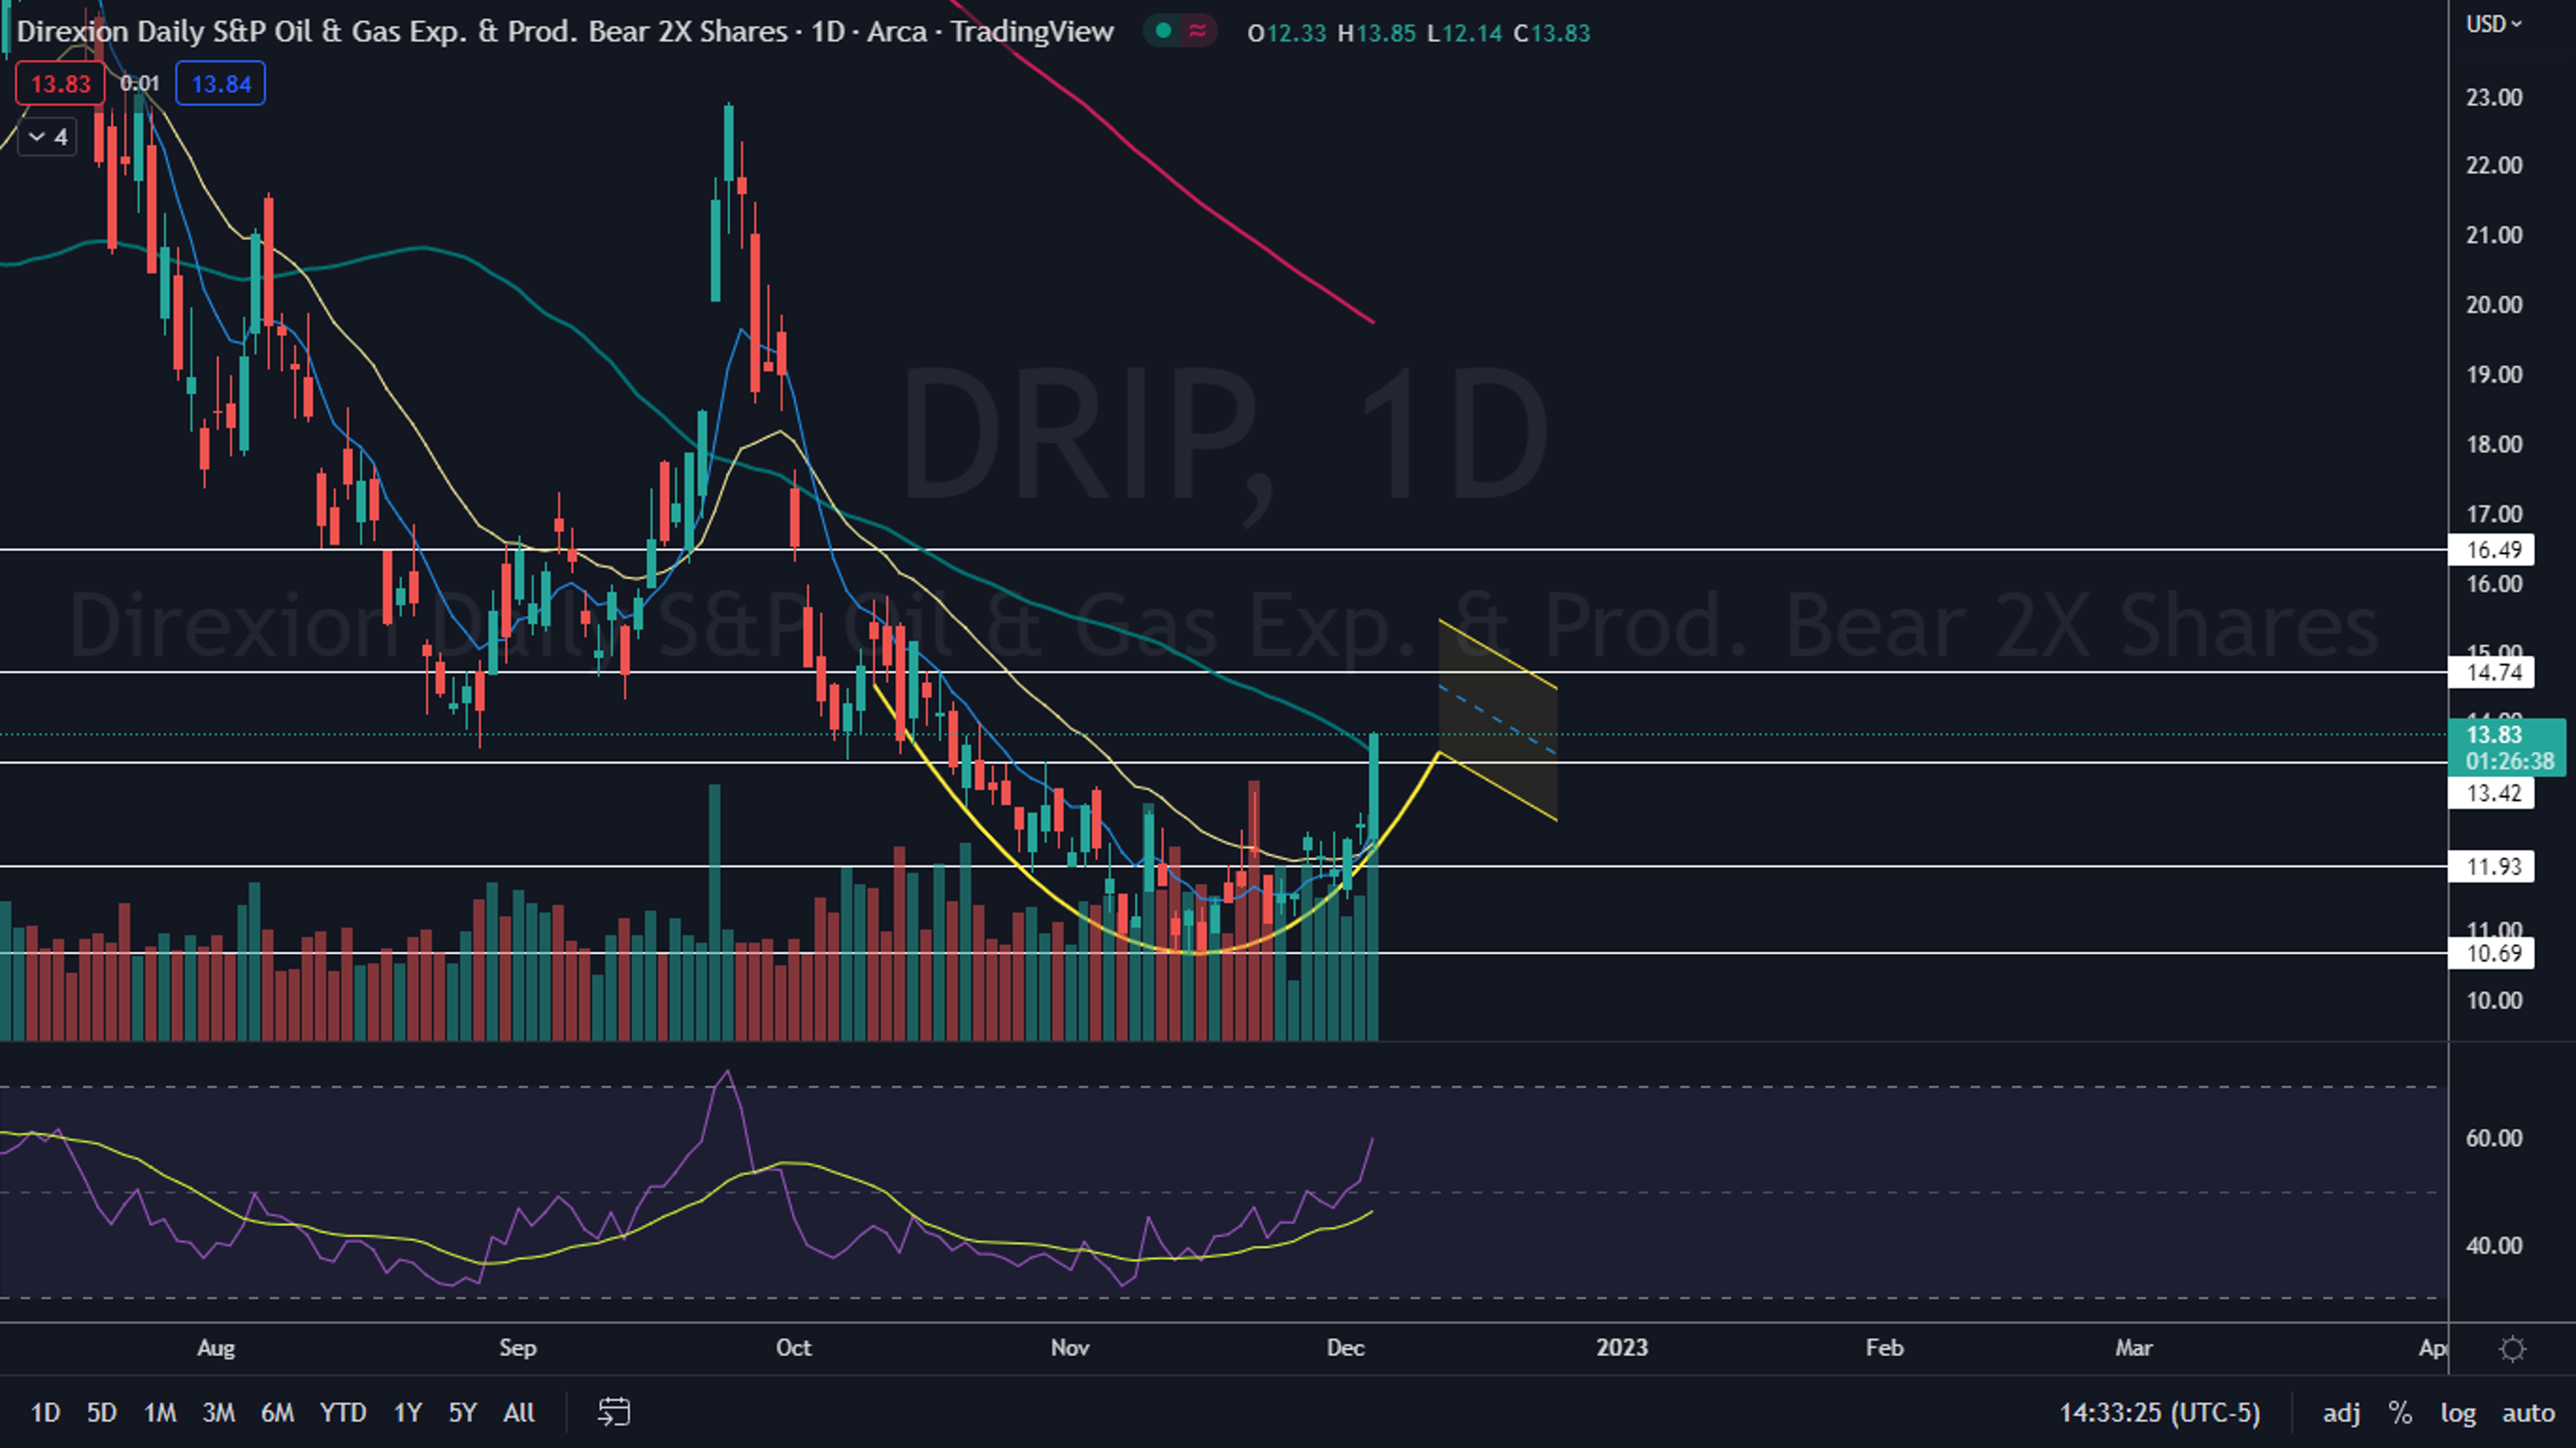
Photo via Shutterstock.
© 2024 Benzinga.com. Benzinga does not provide investment advice. All rights reserved.
Trade confidently with insights and alerts from analyst ratings, free reports and breaking news that affects the stocks you care about.

