


Direxion Daily S&P Oil & Gas Exp & Prod Bull 2X Shares GUSH gapped down about 6% to start Monday’s trading session after the United Arab Emirates (UAE) said it planned to slash its crude oil exports to some term contract clients in Asia by 5% next month.
China, a top crude oil importer, increased its strict COVID-19 lockdowns recently, causing rare protests to erupt in the country. The lockdowns are causing oil demand to wane as travel in areas of the country becomes more restricted.
Despite the news, Raymond James analyst John Freeman raised the price target on Marathon Oil Corporation Corp MRO from $37 to $48 and maintained a Strong Buy rating on the stock. Exxon Mobil Corp XOM and Chevron Corporation CVX both have their price targets bumped higher earlier this month, indicating analysts are bullish for the oil and gas sector.
GUSH is a double-leveraged fund designed to outperform companies held in the S&P Oil & Gas Exploration & Production Select Industry Index by 200%.
A few of the most popular companies held in the ETF are Exxon, which is weighted at 1.17% within the ETF; Occidental Petroleum Corporation OXY, weighted at 1.06%; and Marathon Oil, weighted at 1.15%.
It should be noted that leveraged ETFs are meant to be used as a trading vehicle as opposed to long-term investments.
For traders looking to play the oil and gas sector bearishly, Direxion offers the Direxion Daily S&P Oil & Gas Exp & Prod Bear 2X Shares DRIP.
Want direct analysis? Find me in the BZ Pro lounge! Click here for a free trial.
The GUSH Chart: GUSH has been trading in a downtrend since Nov. 14, making a series of lower highs and lower lows. GUSH’s most recent lower high was formed on Nov. 22 at $196.50 and the most recent confirmed lower low was printed at the $167.21 mark the day prior.
- On Monday, GUSH was looking to close near its opening price, which could cause the ETF to print a doji candlestick on the daily chart. When a doji is printed when a stock is falling it can indicate a bounce to the upside is imminent.
- If GUSH rebounds on Tuesday, a higher low will occur, which will negate the current downtrend. If the ETF continues to fall, bullish traders can watch for GUSH to eventually print another bullish reversal candlestick, such as a doji or hammer candlestick, to indicate the next lower low is in and a bounce is on the horizon.
- If the ETF continues to decline, traders can watch for a reversal to possible form on the 200-day simple moving average (SMA). The 200-day SMA is a solid support level and a stock or ETF is unlikely to slip through the area on the first attempt.
- GUSH has resistance above at $181.10 and $196.12 and support below at $167.21 and $153.53.

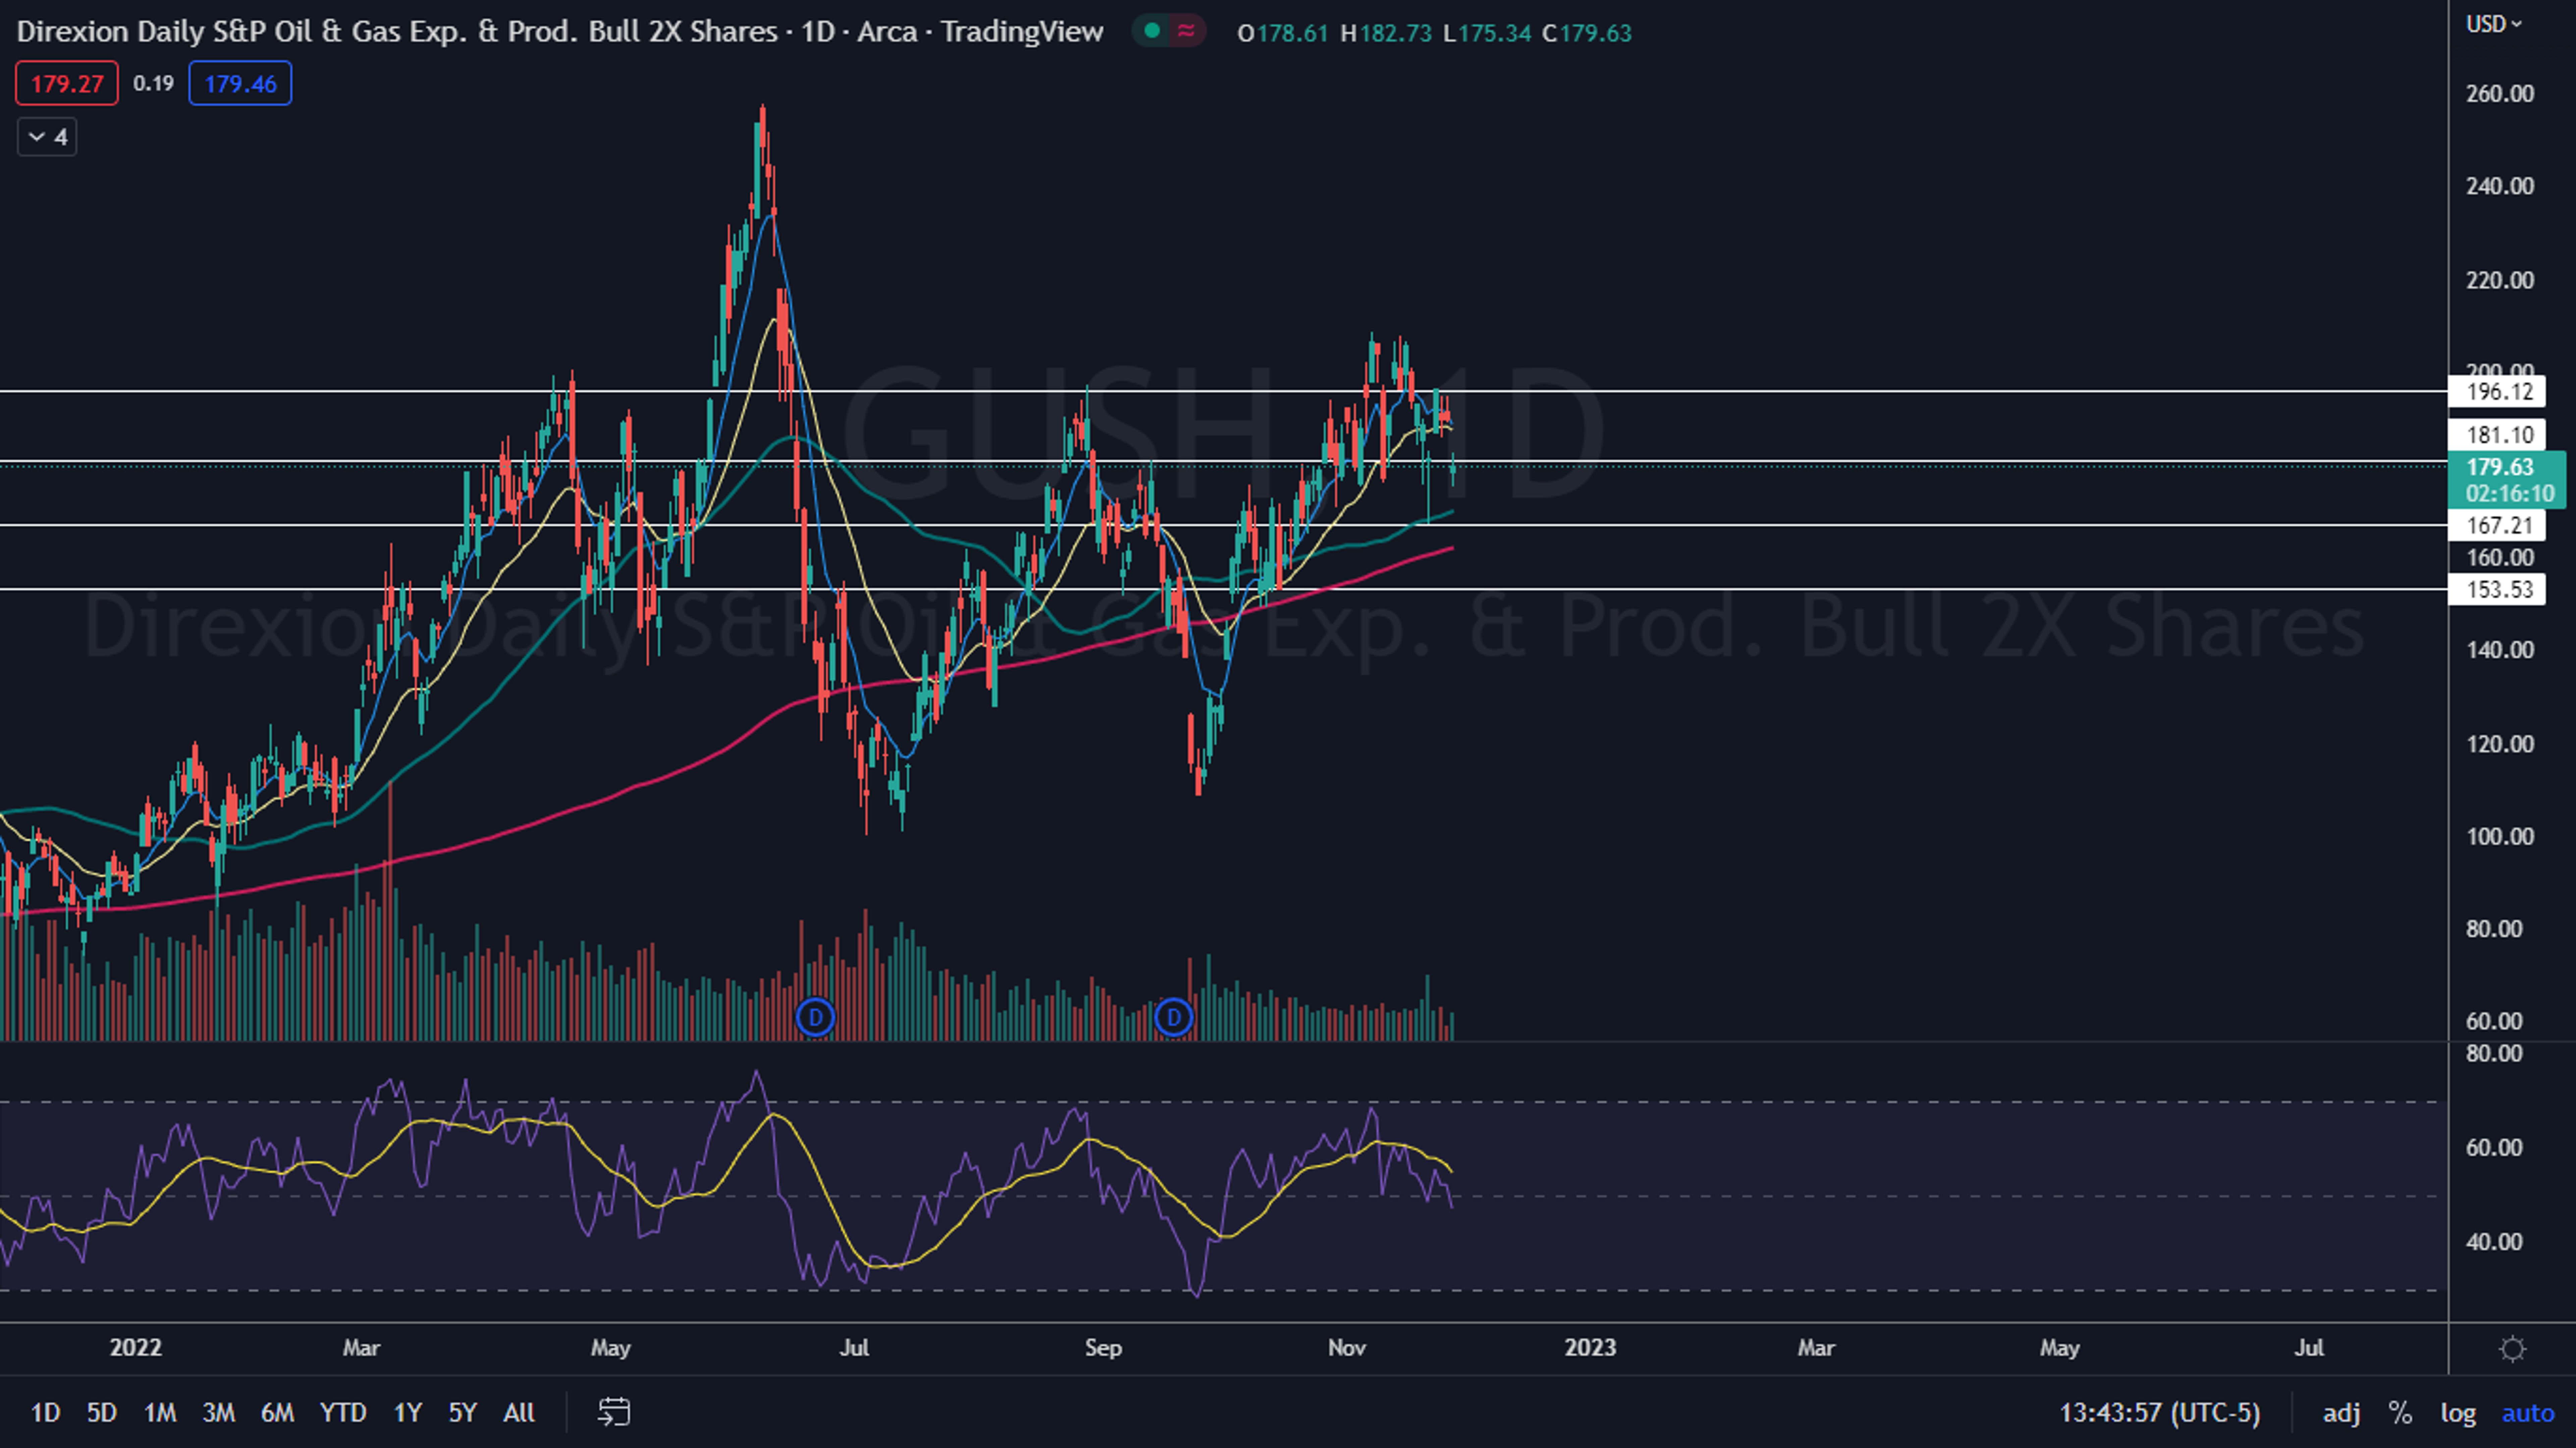
Photo: Shutterstock
© 2024 Benzinga.com. Benzinga does not provide investment advice. All rights reserved.
Trade confidently with insights and alerts from analyst ratings, free reports and breaking news that affects the stocks you care about.

