


GameStop Corporation GME was holding strong Monday morning, rising up over 3.5% higher at one point before being knocked down to trade slightly lower in the afternoon.
AMC Entertainment Holdings, Inc AMC and AMC Entertainment Holdings, Inc AMC Preferred Equity APE attempted to break higher as well but ran into groups of sellers, with APE taking the brunt of the bearish price action, trading down over 5%.
The three stocks are showing signs of indecision, as is the general market, ahead of the Federal Reserve’s decision on interest rate hikes, expected on Wednesday at 2:00 p.m. EDT.
Consumer price index data released by the U.S. Labor Department last week showed inflation remained elevated above expectations in August, despite four separate rate hikes initiated in March, May, June and July. The news brought fear that the Fed could hike rates by 0.75% or even by a full percentage point later this week.
On Monday, AMC, APE and GameStop were trading on lower-than-average volume, which indicates traders and investors may be waiting to hear how high the central bank will hike rates before entering into new positions.
Here’s a look at the three stocks:
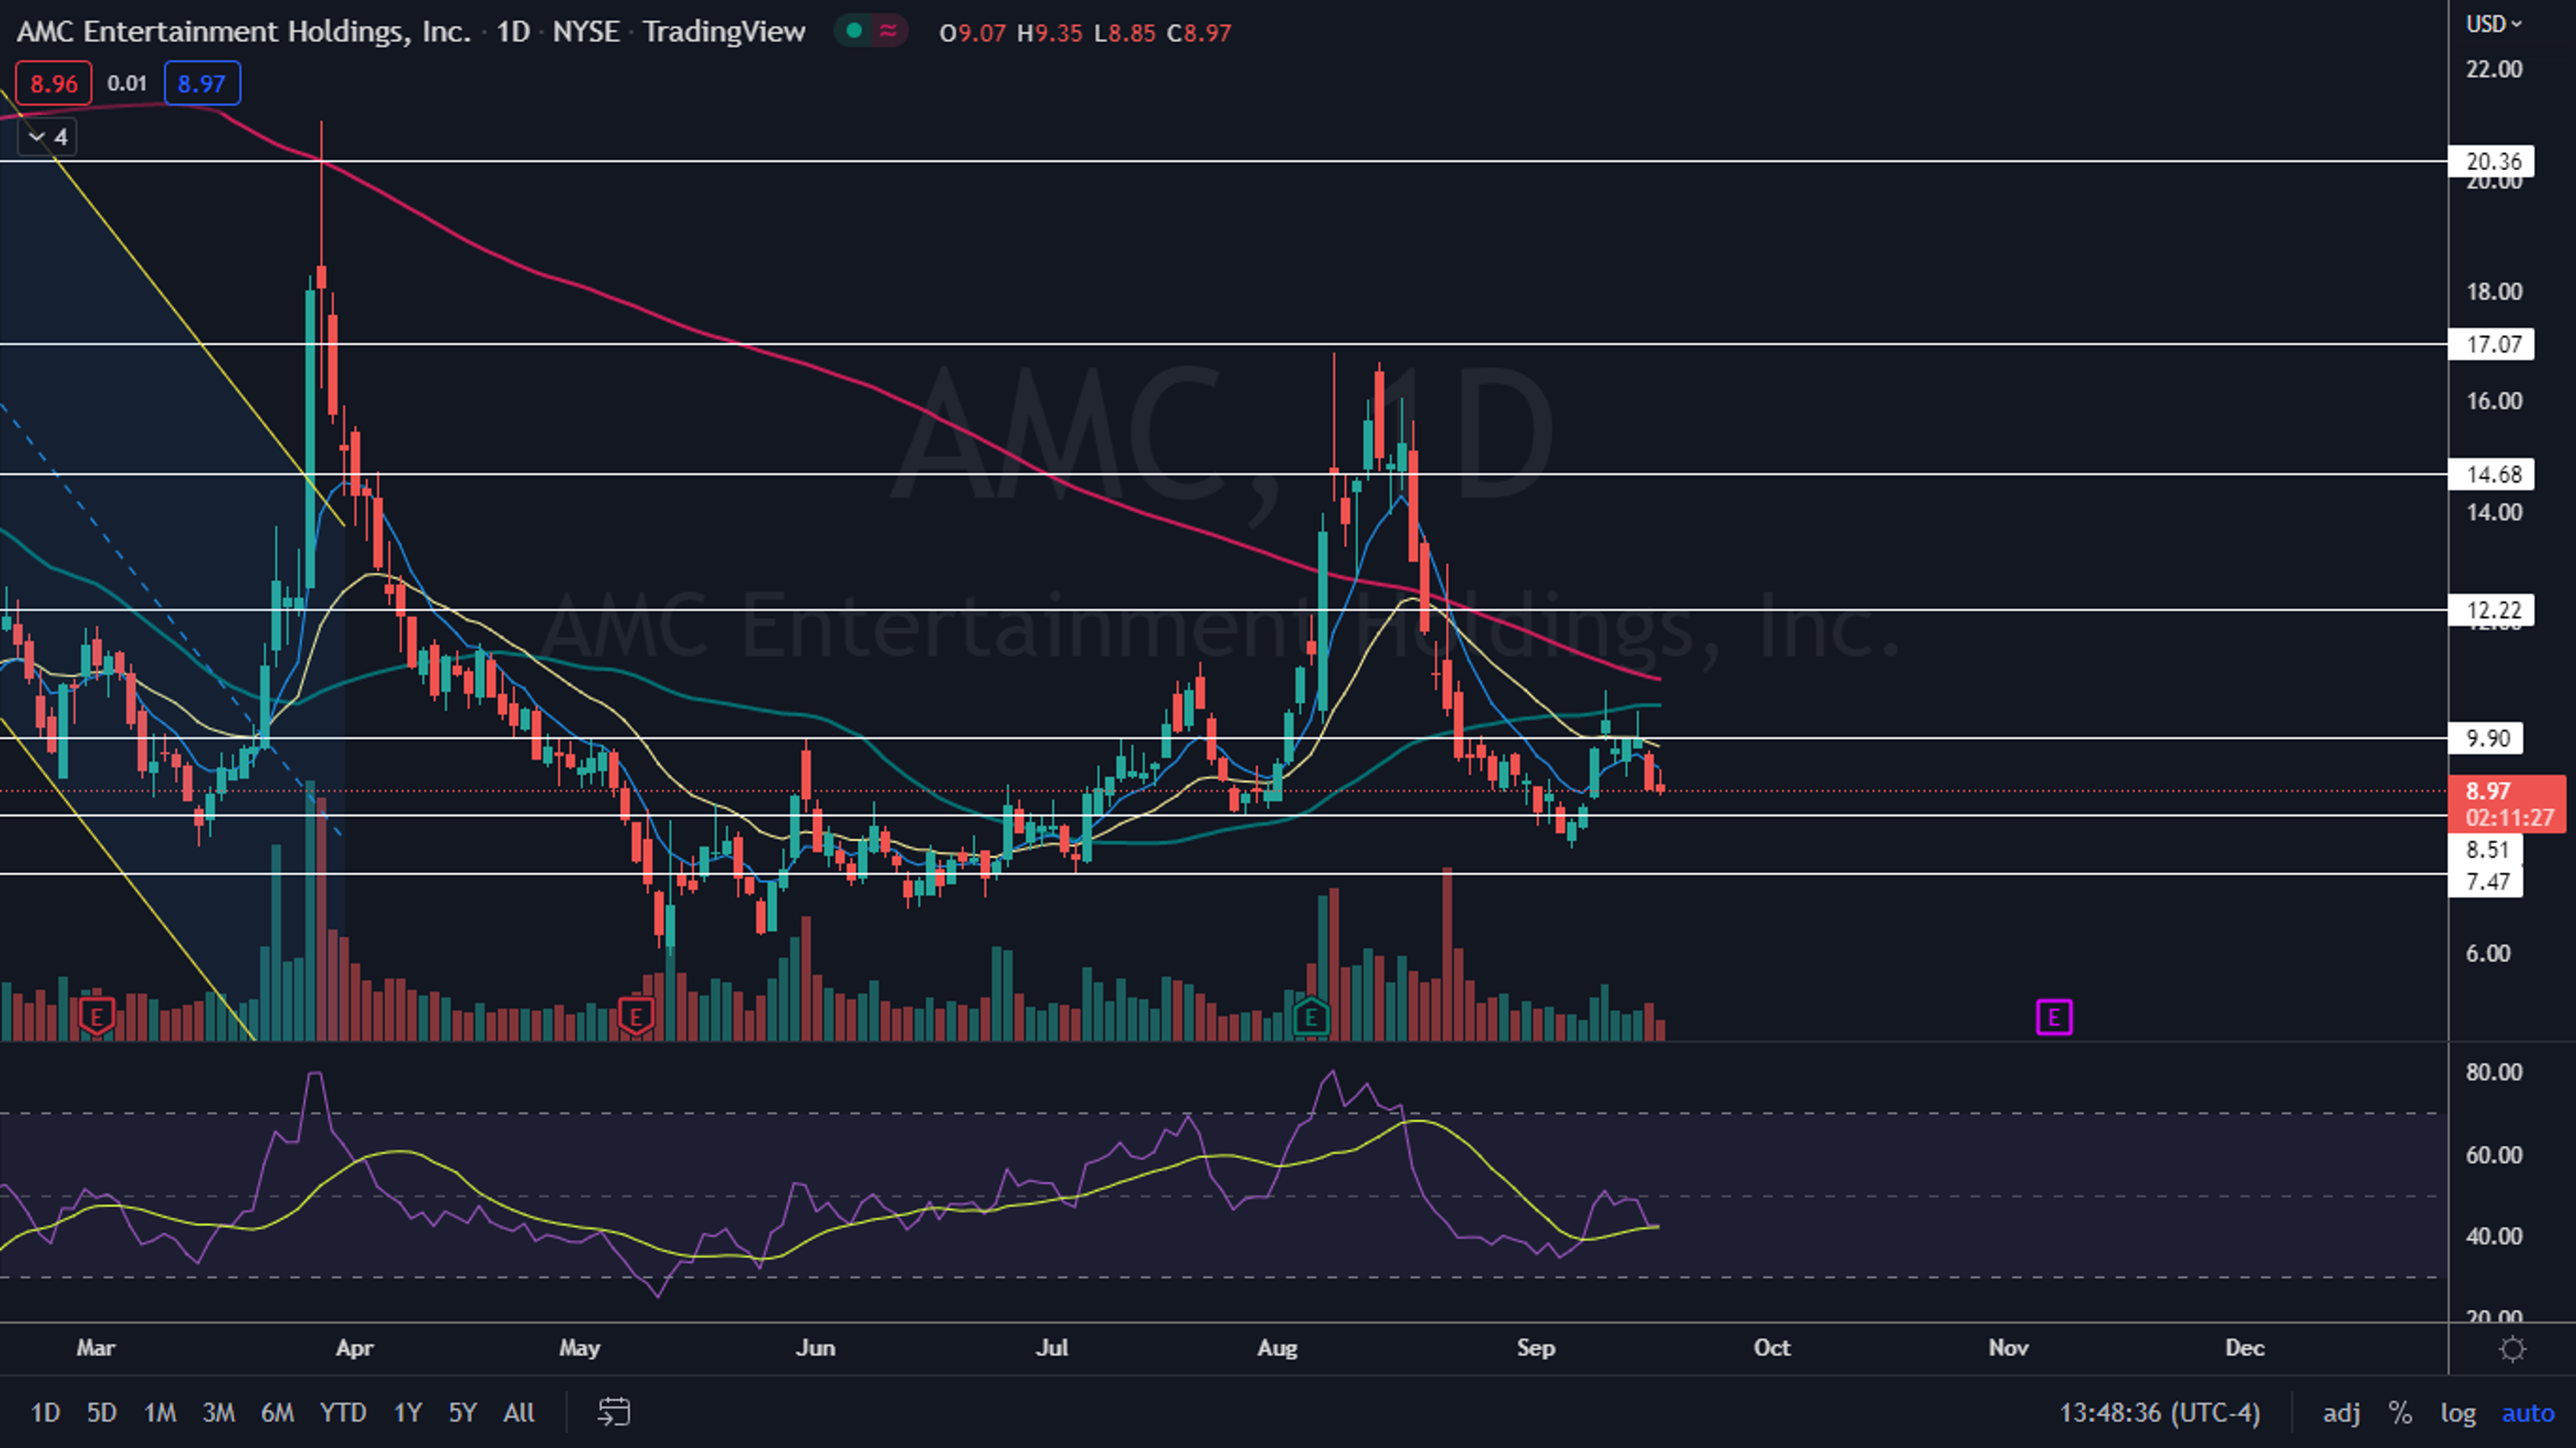
The AMC Entertainment Chart: AMC started trading in a downtrend on Sept. 12 after topping out at $10.75. The most recent lower high within the trend was formed on Sept. 15 at $10.39 and the most recent confirmed lower low was printed at the $9.21 level the day prior.
On Monday, AMC was working to print an inverted hammer candlestick on the daily chart, which could indicate the next lower low is occurring, and the stock will bounce up on Tuesday. An inverted hammer candlestick found in a downtrend can indicate the temporary bottom is in, but Tuesday’s candle will have to print for verification.
AMC has resistance above at $9.90 and $12.22 and support below at $8.51 and $7.47.

If AMC bounced up on Tuesday, APE is likely to follow suit.
APE has resistance above at $5.21 and $6.08. The only support below in terms of price history is at the all-time low of $4.40.

The GameStop Chart: GameStop has been trading in a tightening pattern between a descending upper trendline and an ascending lower trendline since Sept. 12. The formation, paired with a 33% drop between Aug. 23 and Sept. 7 could be setting the stock into a bear flag pattern.
Traders and investors can watch for GameStop to break up or down from the triangle on higher-than-average volume before the stock reaches the apex on Wednesday, although the pattern leans bearish. If the stock breaks up from the triangle on higher-than-average volume and regains support at the 21-day exponential moving average, the bear flag will be negated.
GameStop has resistance above at $32.29 and $35.53 and support below at $28.34 and $24.03.

See Also: GameStop, Gods Unchained Partner On Exclusive NFTs: How You Can Get A Free NFT Trading Card Pack
© 2024 Benzinga.com. Benzinga does not provide investment advice. All rights reserved.
Trade confidently with insights and alerts from analyst ratings, free reports and breaking news that affects the stocks you care about.

