Benzinga

España
Italia
대한민국
日本
Français
Benzinga Edge
Benzinga Research
Benzinga Pro

  • Get Benzinga Pro
  • Data & APIs
  • Events
  • Premarket
  • Advertise
Contribute
España
Italia
대한민국
日本
Français

Benzinga

  • Premium Services
  • Financial News
    Latest
    Earnings
    Guidance
    Dividends
    M&A
    Buybacks
    Interviews
    Management
    Offerings
    IPOs
    Insider Trades
    Biotech/FDA
    Politics
    Healthcare
    Small-Cap
  • Markets
    Pre-Market
    After Hours
    Movers
    ETFs
    Options
    Cryptocurrency
    Commodities
    Bonds
    Futures
    Mining
    Real Estate
    Volatility
  • Ratings
    Analyst Color
    Downgrades
    Upgrades
    Initiations
    Price Target
  • Investing Ideas
    Trade Ideas
    Long Ideas
    Short Ideas
    Technicals
    Analyst Ratings
    Analyst Color
    Latest Rumors
    Whisper Index
    Stock of the Day
    Best Stocks & ETFs
    Best Penny Stocks
    Best S&P 500 ETFs
    Best Swing Trade Stocks
    Best Blue Chip Stocks
    Best High-Volume Penny Stocks
    Best Small Cap ETFs
    Best Stocks to Day Trade
    Best REITs
  • Money
    Investing
    Cryptocurrency
    Mortgage
    Insurance
    Yield
    Personal Finance
    Forex
    Startup Investing
    Real Estate Investing
    Prop Trading
    Credit Cards
    Stock Brokers
Research
My Stocks
Tools
Free Benzinga Pro Trial
Calendars
Analyst Ratings Calendar
Conference Call Calendar
Dividend Calendar
Earnings Calendar
Economic Calendar
FDA Calendar
Guidance Calendar
IPO Calendar
M&A Calendar
Unusual Options Activity Calendar
SPAC Calendar
Stock Split Calendar
Trade Ideas
Stock Reports
Insider Trades
Trade Idea Feed
Analyst Ratings
Unusual Options Activity
Heatmaps
Free Newsletter
Government Trades
Perfect Stock Portfolio
Easy Income Portfolio
Short Interest
Most Shorted
Largest Increase
Largest Decrease
Calculators
Margin Calculator
Forex Profit Calculator
100x Options Profit Calculator
Screeners
Stock Screener
Top Momentum Stocks
Top Quality Stocks
Top Value Stocks
Top Growth Stocks
Compare Best Stocks
Best Momentum Stocks
Best Quality Stocks
Best Value Stocks
Best Growth Stocks
Connect With Us
facebookinstagramlinkedintwitteryoutubeblueskymastodon
About Benzinga
  • About Us
  • Careers
  • Advertise
  • Contact Us
Market Resources
  • Advanced Stock Screener Tools
  • Options Trading Chain Analysis
  • Comprehensive Earnings Calendar
  • Dividend Investor Calendar and Alerts
  • Economic Calendar and Market Events
  • IPO Calendar and New Listings
  • Market Outlook and Analysis
  • Wall Street Analyst Ratings and Targets
Trading Tools & Education
  • Benzinga Pro Trading Platform
  • Options Trading Strategies and News
  • Stock Market Trading Ideas and Analysis
  • Technical Analysis Charts and Indicators
  • Fundamental Analysis and Valuation
  • Day Trading Guides and Strategies
  • Live Investor Events
  • Pre-market Stock Analysis and News
  • Cryptocurrency Market Analysis and News
Ring the Bell

A newsletter built for market enthusiasts by market enthusiasts. Top stories, top movers, and trade ideas delivered to your inbox every weekday before and after the market closes.

  • Terms & Conditions
  • Do Not Sell My Personal Data/Privacy Policy
  • Disclaimer
  • Service Status
  • Sitemap
© 2026 Benzinga | All Rights Reserved
August 16, 2022 11:49 AM 2 min read

Walmart Surges Following Q2 Earnings Beat: Here's What To Watch On The Stock

by Melanie Schaffer Benzinga Editor
Follow
WMT Logo
WMTWalmart Inc
$127.70-0.09%
Overview

Walmart, Inc (NYSE:WMT) gapped up over 4.75% off Monday’s close and regained the 200-day simple moving average (SMA) after printing second-quarter 2023 financial results.

For the quarter, Walmart reported adjusted EPS of $1.77 on revenues of $152.86 billion, which beat the consensus estimate of $1.62 and revenues of $150.75 billion.

The multinational retail corporation posted strong growth despite soaring inflation, a series of interest rate hikes and fears of a looming recession. Walmart U.S. net sales rose 7.1% year-over-year, while sales from the international segment increased 5.7%.

Walmart guided its full-year 2023 profits lower, however, forecasting adjusted EPS to decline between 9% and 11%.

The move higher on Tuesday saw Walmart working to erase a massive decline the company suffered after printing first-quarter earnings on May 17, where the stock plunged 20% between that date and May 20.

Want direct analysis? Find me in the BZ Pro lounge! Click here for a free trial.

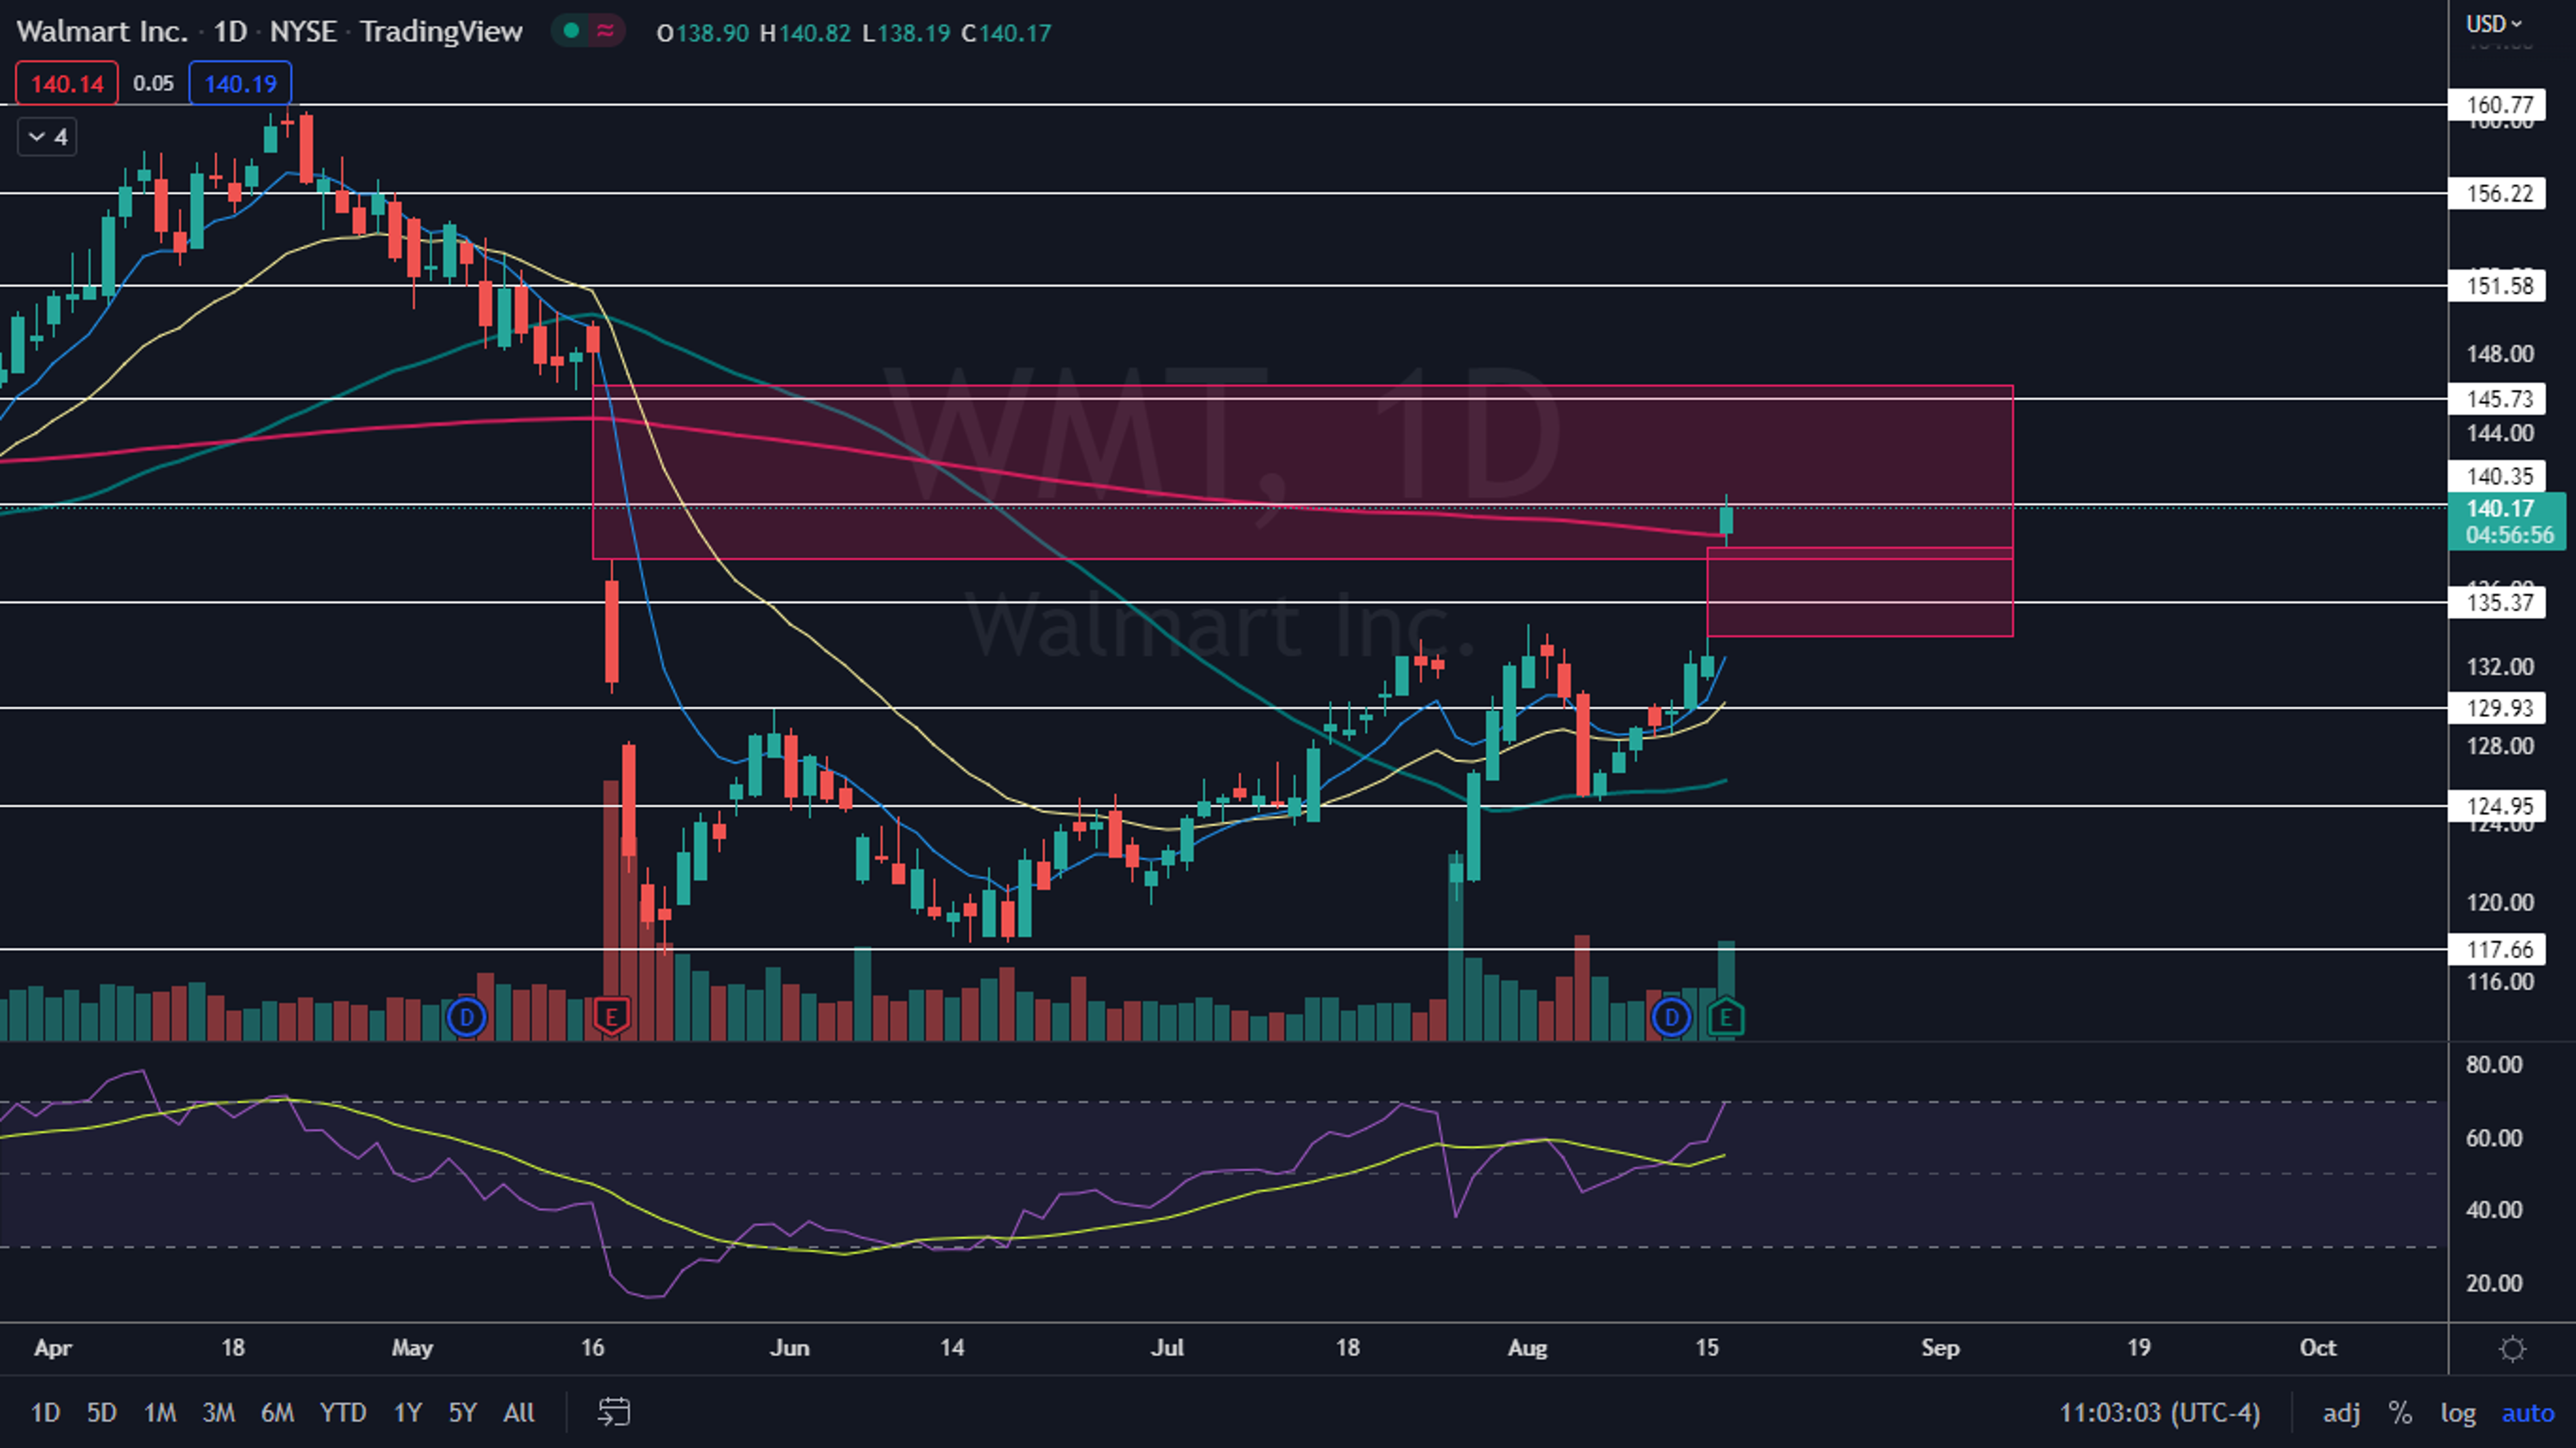
The Walmart Chart: Walmart began trading in its current uptrend on July 26, when the stock bounced up off the $120.06 level. The company’s most recent higher low within the uptrend was printed on Aug. 5 and $125.12 and the most recent confirmed higher high was formed at the $134.23 mark on Aug. 1.

See Also: Why Is Target Stock Trading Higher?

Photo: Created with an image from Mike Mozart on flickr

Market News and Data brought to you by Benzinga APIs

© 2026 Benzinga.com. Benzinga does not provide investment advice. All rights reserved.

To add Benzinga News as your preferred source on Google, click here.


Posted In:
Long IdeasShort IdeasTechnicalsMoversTrading Ideas
  • Walmart is now trading above the 200-day SMA, which indicates the stock is trading in a new bull cycle. If Walmart can remain trading above the 200-day for a period, the 50-day SMA will eventually cross above the 200-day, which will cause a golden cross to form on Walmart’s chart.
  • On Tuesday, Walmart was working to close a gap between $137.44 and $146.46. The gap-up open left a lower range empty, however, between $133.57 and $139.19, which likely makes some bullish traders weary. Gaps on charts fill about 90% of the time, which makes it likely Walmart will fill both empty trading ranges in the future.
  • Conservative bullish traders may choose to wait until Walmart declines to fill the lower gap and then prints a reversal candlestick, such as a doji or hammer candlestick, near the lower range to signal a reversal to the upside is in the cards. A retracement lower is likely to come soon because Walmart’s relative strength index is in overbought territory, measuring in at about 71%.
  • Conservative bearish traders will want to wait for Walmart to signal that buyers have become exhausted, and then for big bearish volume to drop the stock back below the 200-day SMA. Bearish traders can watch for Walmart to print a bearish reversal candlestick such as a doji or shooting star candlestick to suggest the current top for the stock is in.
  • Walmart has resistance above at $145.73 and $151.58 and support below at $140.35 and $135.37.
WMT Logo
WMTWalmart Inc
$127.70-0.09%
Overview
Comments
Loading...