


Amazon.com, Inc AMZN gapped up almost 10% higher on Friday, in a bullish reaction to the company’s earnings beat.
For the second quarter, Amazon reported earnings per share of 18 cents on revenues of $121.23 billion, which beat the consensus estimate of EPS of 13 cents on revenues of $119.09 billion.
The earnings beat likely surprised traders who were expecting worse results after Amazon reported mixed earnings for the first quarter and lowered its guidance for the second quarter.
Amazon, and Apple, Inc AAPL, which also enjoyed a bullish reaction to its quarterly report on Friday, can be a good indicator as to the future direction of the S&P 500, because of how heavily weighted the e-commerce and streaming giant is within the index. Amazon holds the third-largest rating in the S&P 500 at 3.11%, behind Apple and Microsoft, with holdings of 7.08% and 5.9%, respectively.
Although Amazon looks set to trade higher over the longer-term due to its strong uptrend, a pullback is likely on the horizon over the coming days due to the stock, as well as the general markets, entering into overbought territory.
Want direct analysis? Find me in the BZ Pro lounge! Click here for a free trial.
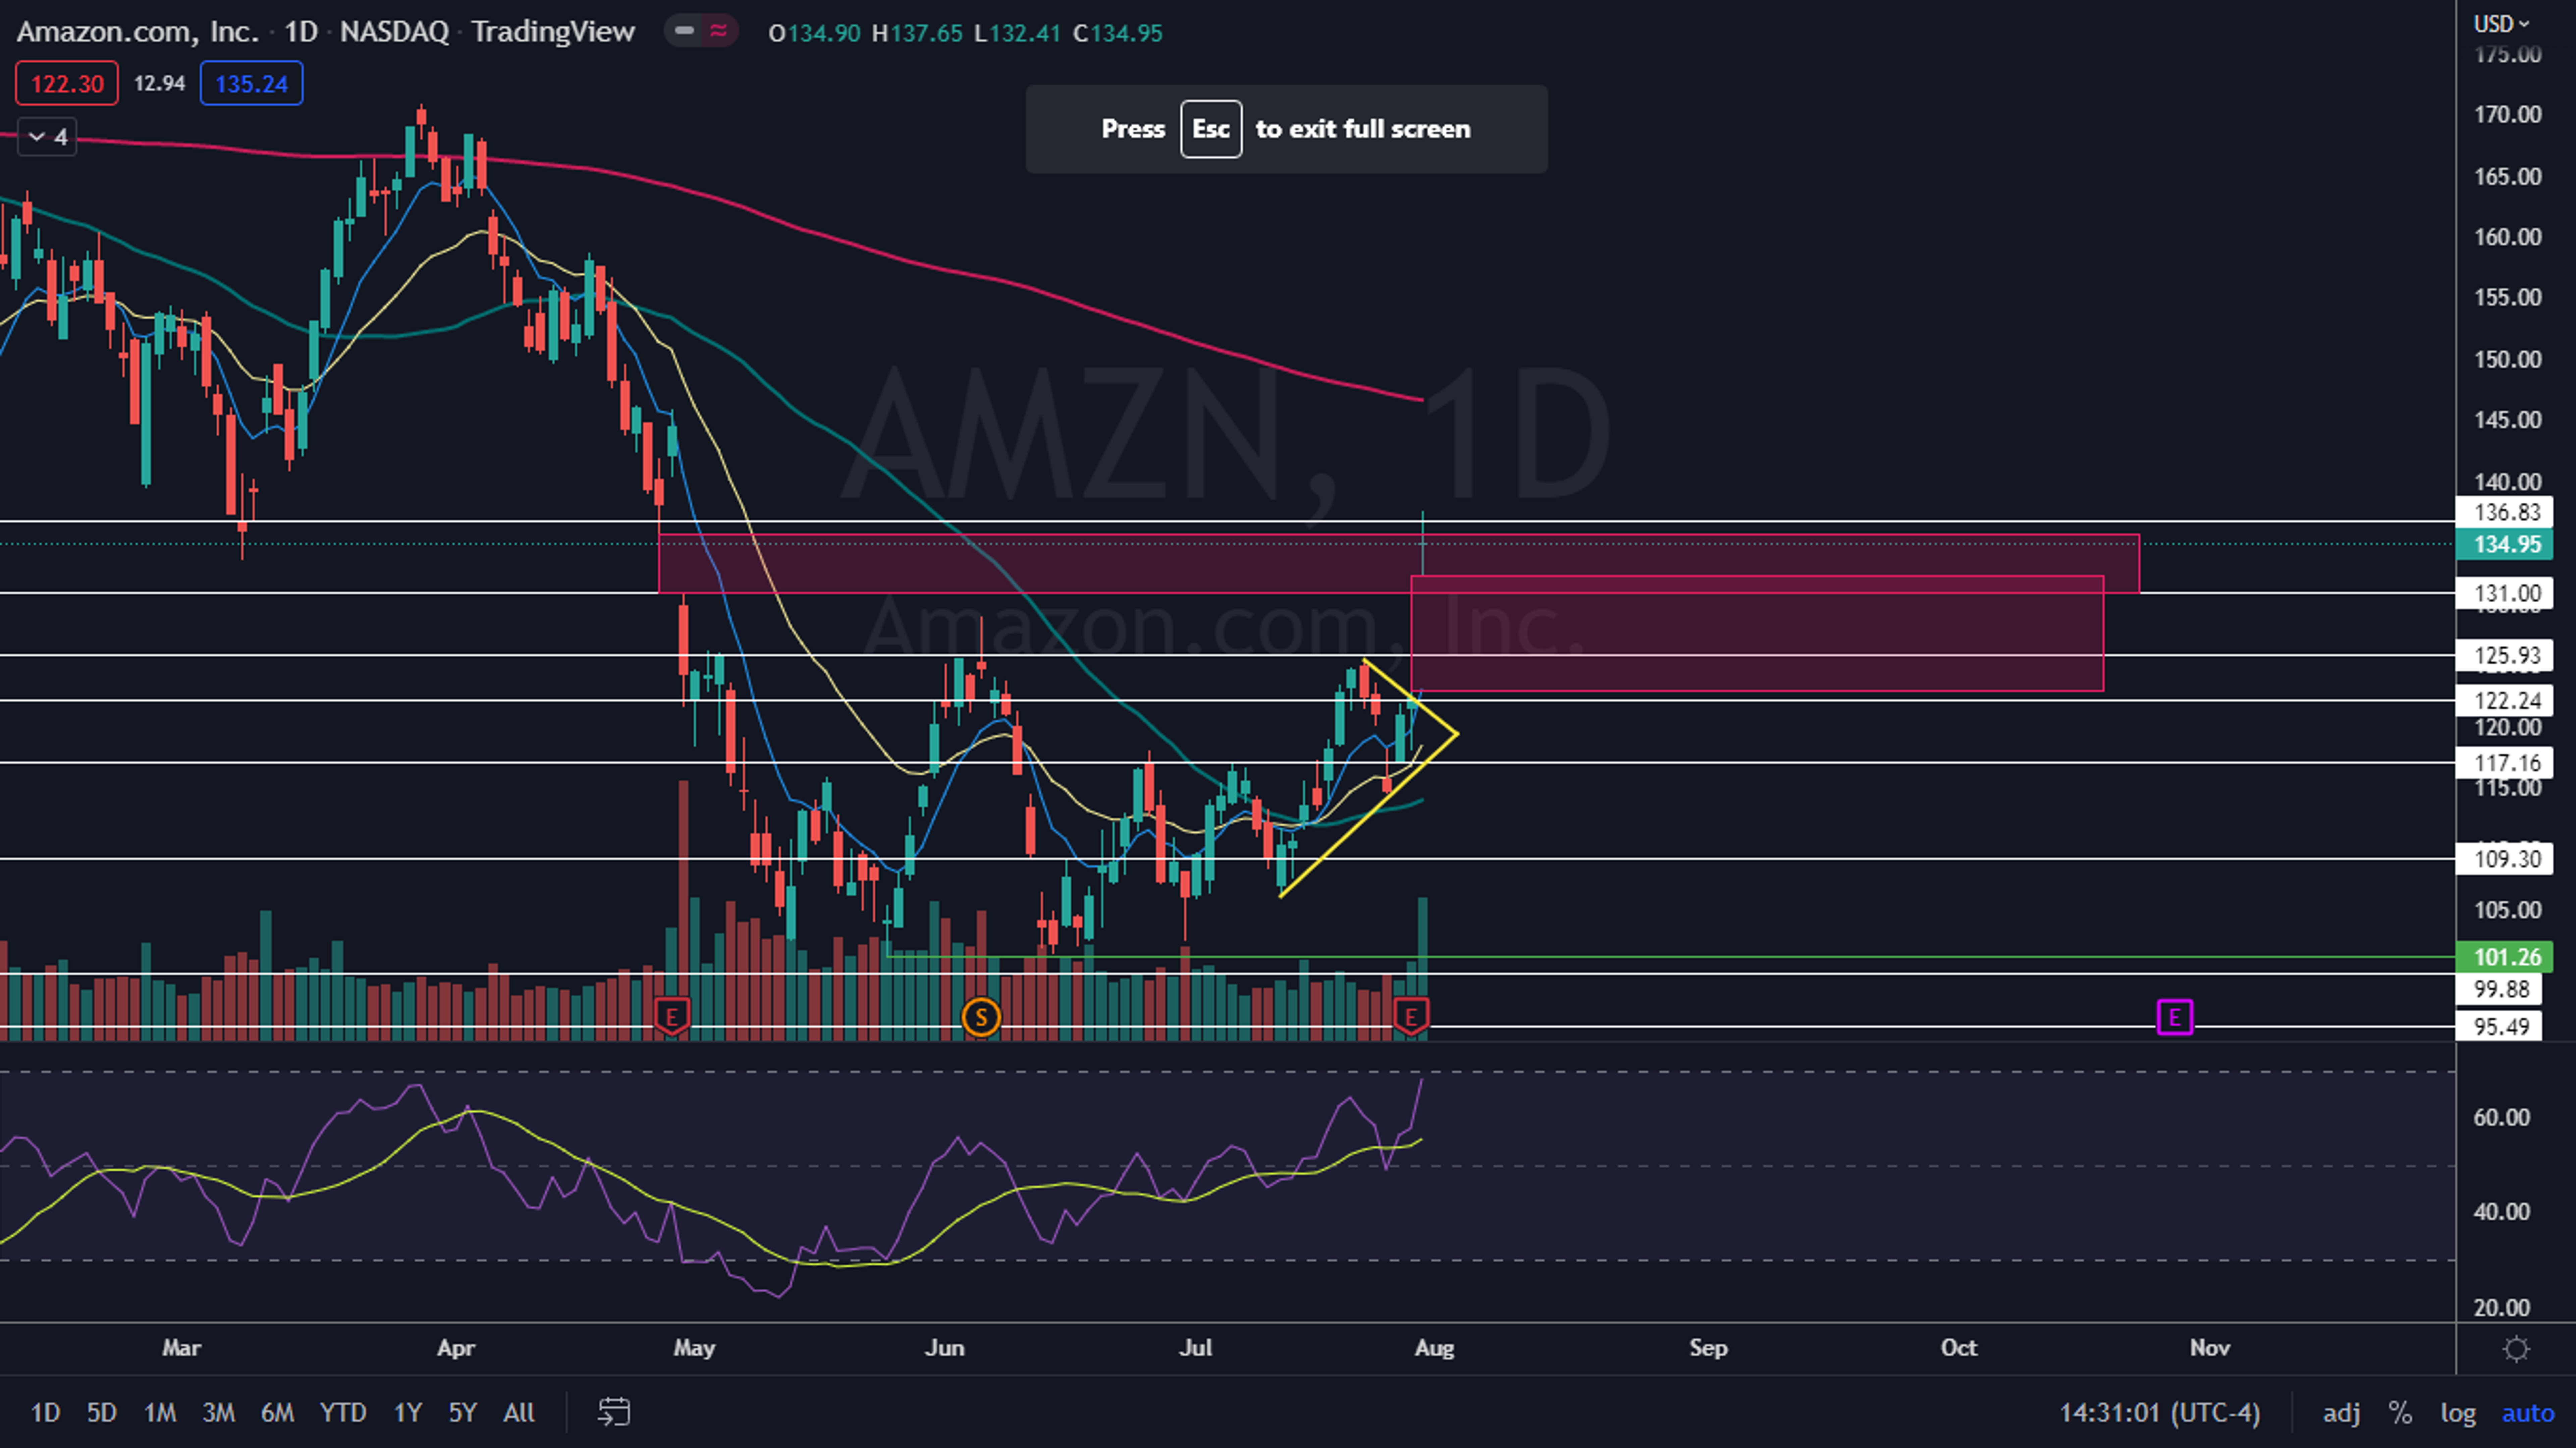
The Amazon Chart: On Friday, Amazon printed a long-legged doji candlestick, which indicates the temporary top may be in, and the stock will retrace to the downside on Monday. If that happens, the lower gap that was left behind between $122.84 and $132.42 may fill.
- Bullish traders would prefer for the gap to fill because gaps fill about 90% of the time. Traders can then watch for Amazon to print a bullish reversal candlestick, such as another doji or hammer candlestick, at the lower range of the gap.
- Amazon is trading in a confirmed uptrend, with the most recent higher low printed on July 26 at $114.53 and the most recent confirmed higher high formed at the $125.50 level on July 22. Amazon hasn’t printed another higher low on the daily chart since soaring almost 18% off the most recent higher low, which indicates a retracement is needed.
- Amazon has resistance above at $136.83 and $142.18 and support below at $131 and $125.93.

See Also: 6 Amazon Analysts React To Q2 Earnings Report: 'Our Top '22 FANG Stock'
© 2024 Benzinga.com. Benzinga does not provide investment advice. All rights reserved.
Trade confidently with insights and alerts from analyst ratings, free reports and breaking news that affects the stocks you care about.

