Benzinga

España
Italia
대한민국
日本
Français
Benzinga Edge
Benzinga Research
Benzinga Pro

  • Get Benzinga Pro
  • Data & APIs
  • Events
  • Premarket
  • Advertise
Contribute
España
Italia
대한민국
日本
Français

Benzinga

  • Premium Services
  • Financial News
    Latest
    Earnings
    Guidance
    Dividends
    M&A
    Buybacks
    Interviews
    Management
    Offerings
    IPOs
    Insider Trades
    Biotech/FDA
    Politics
    Healthcare
    Small-Cap
  • Markets
    Pre-Market
    After Hours
    Movers
    ETFs
    Options
    Cryptocurrency
    Commodities
    Bonds
    Futures
    Mining
    Real Estate
    Volatility
  • Ratings
    Analyst Color
    Downgrades
    Upgrades
    Initiations
    Price Target
  • Investing Ideas
    Trade Ideas
    Long Ideas
    Short Ideas
    Technicals
    Analyst Ratings
    Analyst Color
    Latest Rumors
    Whisper Index
    Stock of the Day
    Best Stocks & ETFs
    Best Penny Stocks
    Best S&P 500 ETFs
    Best Swing Trade Stocks
    Best Blue Chip Stocks
    Best High-Volume Penny Stocks
    Best Small Cap ETFs
    Best Stocks to Day Trade
    Best REITs
  • Money
    Investing
    Cryptocurrency
    Mortgage
    Insurance
    Yield
    Personal Finance
    Forex
    Startup Investing
    Real Estate Investing
    Prop Trading
    Credit Cards
    Stock Brokers
Research
My Stocks
Tools
Free Benzinga Pro Trial
Calendars
Analyst Ratings Calendar
Conference Call Calendar
Dividend Calendar
Earnings Calendar
Economic Calendar
FDA Calendar
Guidance Calendar
IPO Calendar
M&A Calendar
Unusual Options Activity Calendar
SPAC Calendar
Stock Split Calendar
Trade Ideas
Stock Reports
Insider Trades
Trade Idea Feed
Analyst Ratings
Unusual Options Activity
Heatmaps
Free Newsletter
Government Trades
Perfect Stock Portfolio
Easy Income Portfolio
Short Interest
Most Shorted
Largest Increase
Largest Decrease
Calculators
Margin Calculator
Forex Profit Calculator
100x Options Profit Calculator
Screeners
Stock Screener
Top Momentum Stocks
Top Quality Stocks
Top Value Stocks
Top Growth Stocks
Compare Best Stocks
Best Momentum Stocks
Best Quality Stocks
Best Value Stocks
Best Growth Stocks
Connect With Us
facebookinstagramlinkedintwitteryoutubeblueskymastodon
About Benzinga
  • About Us
  • Careers
  • Advertise
  • Contact Us
Market Resources
  • Advanced Stock Screener Tools
  • Options Trading Chain Analysis
  • Comprehensive Earnings Calendar
  • Dividend Investor Calendar and Alerts
  • Economic Calendar and Market Events
  • IPO Calendar and New Listings
  • Market Outlook and Analysis
  • Wall Street Analyst Ratings and Targets
Trading Tools & Education
  • Benzinga Pro Trading Platform
  • Options Trading Strategies and News
  • Stock Market Trading Ideas and Analysis
  • Technical Analysis Charts and Indicators
  • Fundamental Analysis and Valuation
  • Day Trading Guides and Strategies
  • Live Investor Events
  • Pre-market Stock Analysis and News
  • Cryptocurrency Market Analysis and News
Ring the Bell

A newsletter built for market enthusiasts by market enthusiasts. Top stories, top movers, and trade ideas delivered to your inbox every weekday before and after the market closes.

  • Terms & Conditions
  • Do Not Sell My Personal Data/Privacy Policy
  • Disclaimer
  • Service Status
  • Sitemap
© 2026 Benzinga | All Rights Reserved
June 8, 2021 1:17 PM 2 min read

CarLotz Breaks Out Of Downtrend And May See A Trend Change

by Tyler Bundy Benzinga Staff Writer
Follow
FlipboardIcon version of the Flipboard logo

CarLotz Inc. (NASDAQ:LOTZ) shares traded higher Tuesday as retail traders push the stock up.

The stock was trending throughout the day on StockTwits as momentum from the page likely helped push the stock higher. The company also opened a new hub in Charlottesville Virginia on June 7.

CarLotz was up 24% at $6.686 at last check. Below is a technical look at the stock's chart.

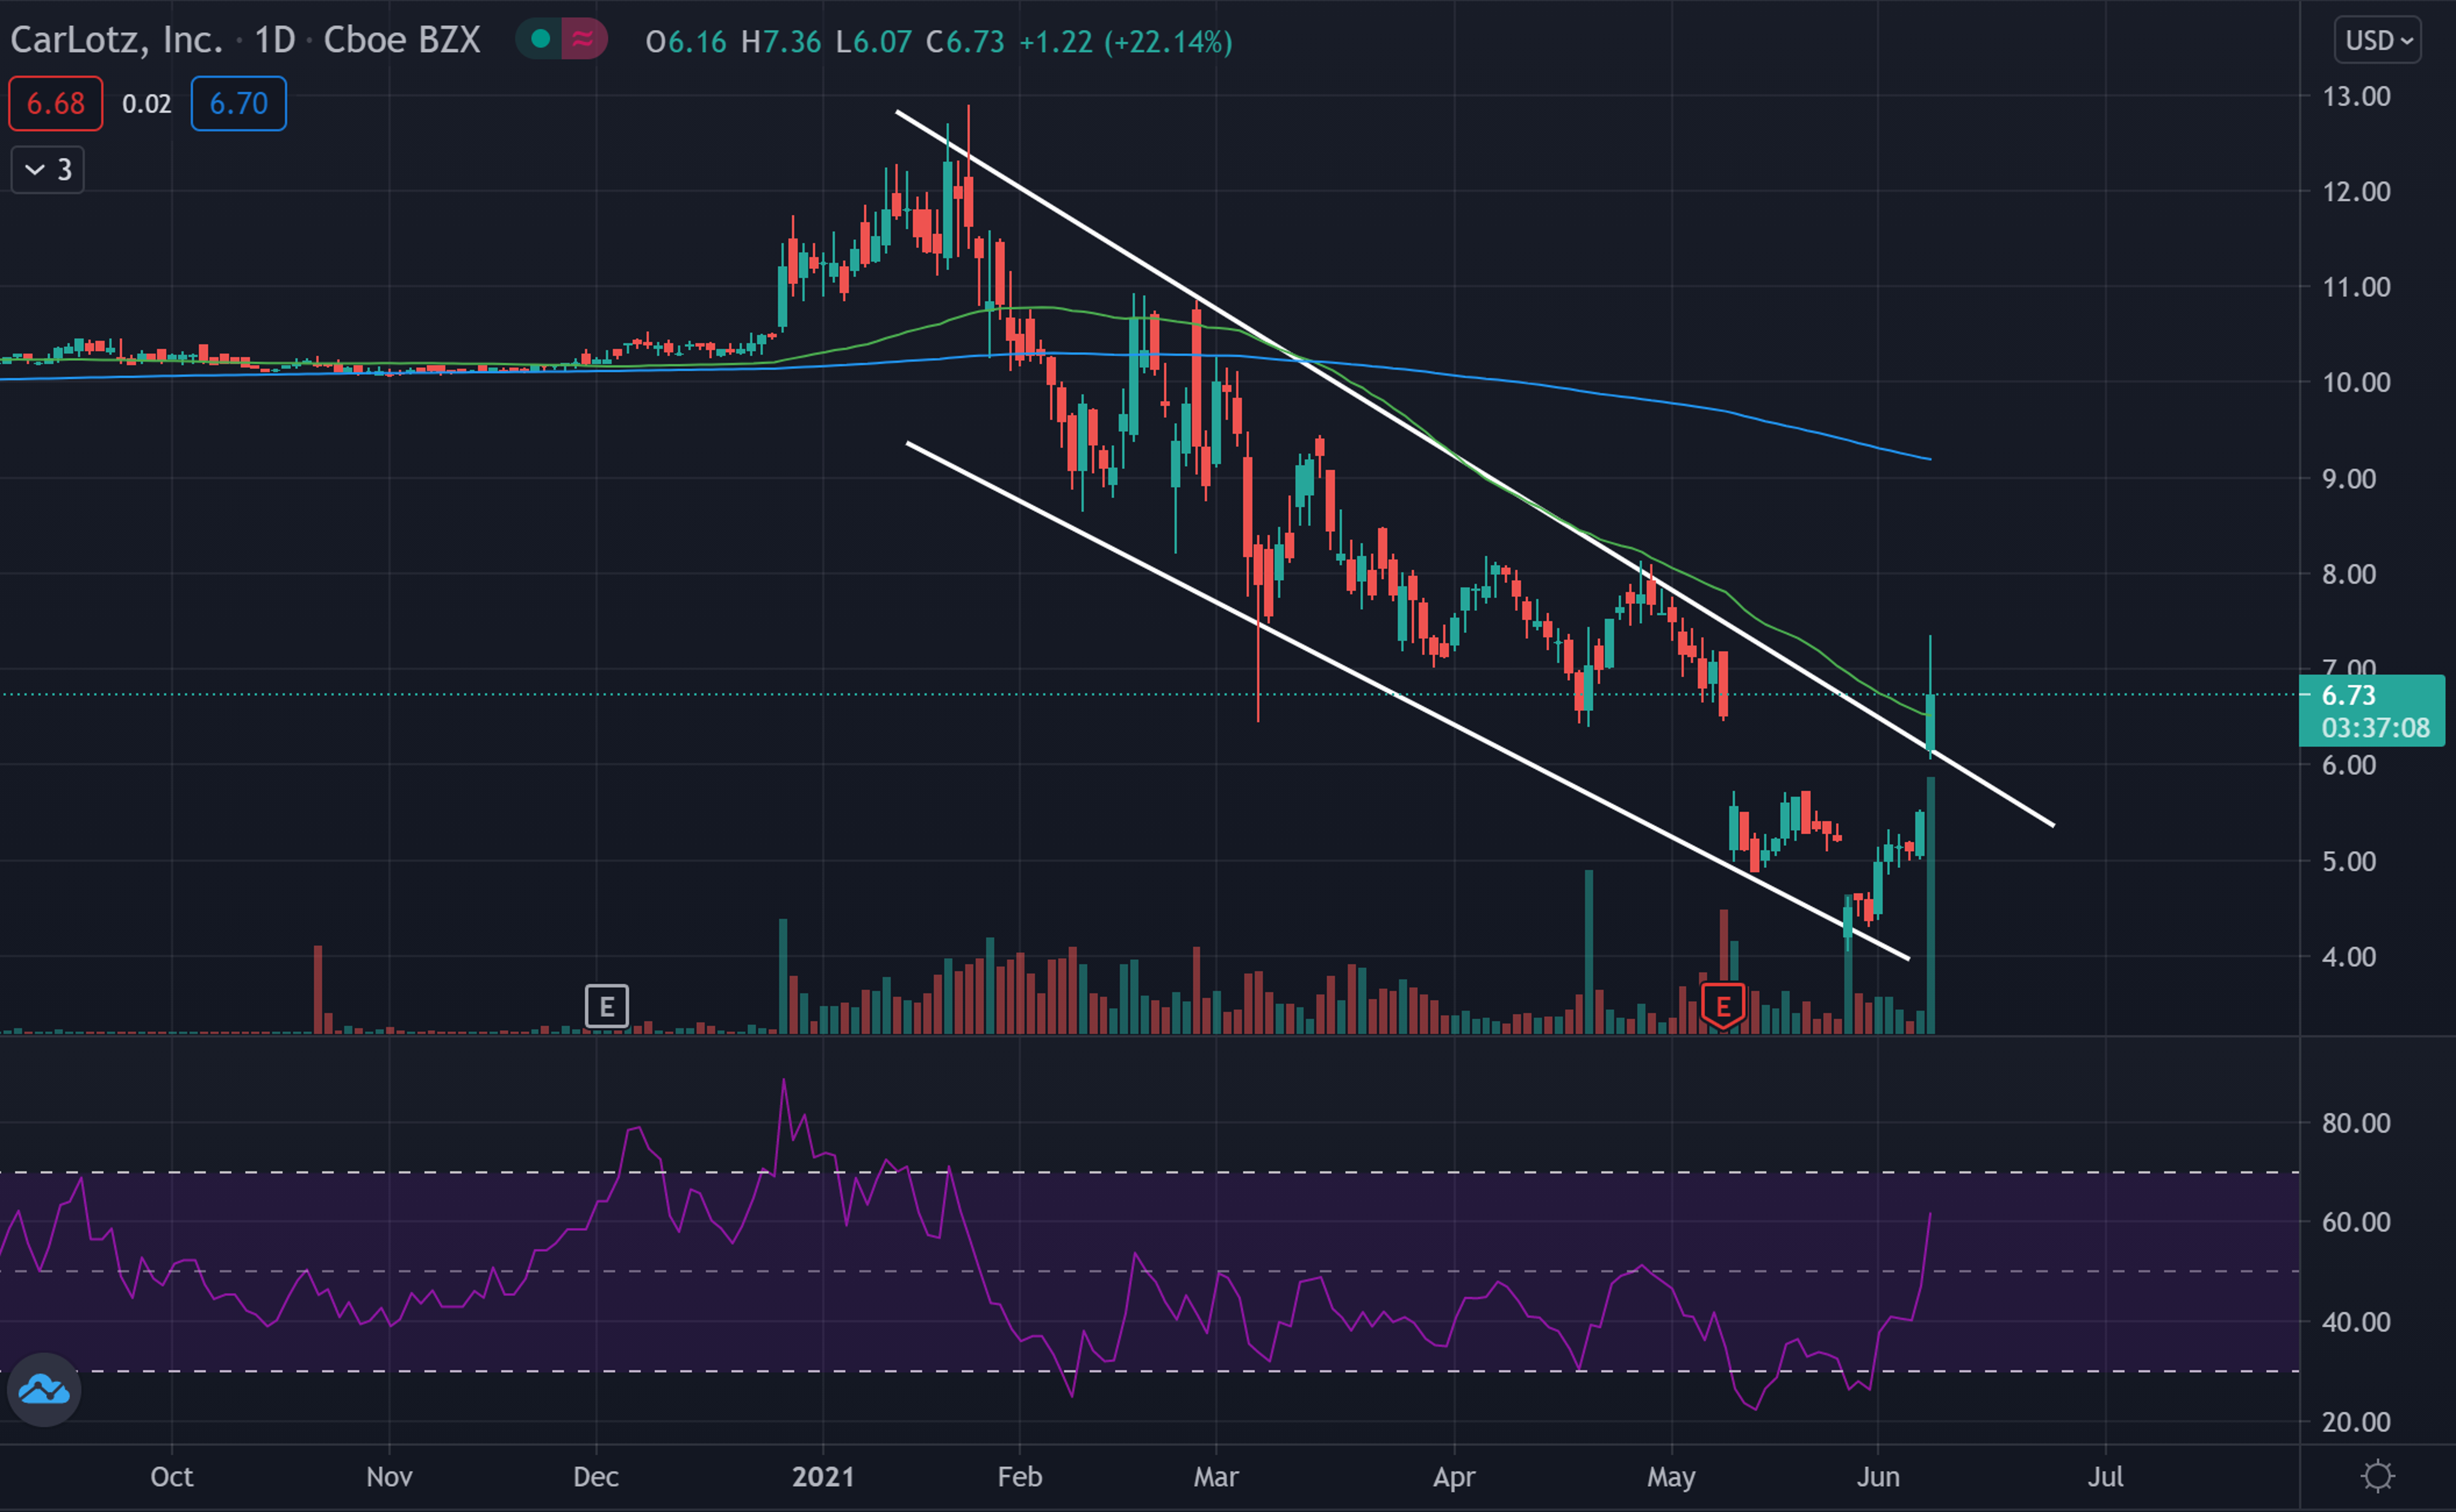
CarLotz Daily Chart Analysis:

  • Shares were falling the past few months in a downwards trending channel, but Tuesday, the stock saw a gap up out of the channel.
  • The stock crossed above the 50-day moving average (green), and trades below the 200-day moving average (blue), indicating sentiment in the stock is becoming less bearish.
  • The 50-day moving average may hold as an area of support, while the 200-day moving average may be a place where the stock finds resistance.

Key Levels To Watch:

What’s Next?

Bullish technical traders would like to see the stock consolidate for a time before the stock may see another move. Bulls want to see the stock hold the gains it made as it consolidates.

Bearish technical traders would like to see the stock fall back into the downwards channel. If the stock fell back to the channel, the next thing that bears would like to see would be a break below the support of the channel. A break below support could cause a large dump to happen.

Market News and Data brought to you by Benzinga APIs

© 2026 Benzinga.com. Benzinga does not provide investment advice. All rights reserved.

To add Benzinga News as your preferred source on Google, click here.


Posted In:
Long IdeasNewsShort IdeasTechnicalsEventsTrading Ideas
Beat the Market With Our Free Pre-Market Newsletter
Enter your email to get Benzinga's ultimate morning update: The PreMarket Activity Newsletter
  • The stock was able to break above the resistance and out of the downward trending channel.
  • The bottom of the channel had previously acted as support while the top of the channel acted as resistance. Now that the stock looks to have broken out, the top line of the channel may hold as support.
  • The Relative Strength Index (RSI) saw a large move up. This means that the stock became much more overbought Tuesday. The stock hasn't entered overbought territory yet, and may continue to move up as the RSI stays high.
Comments
Loading...