


Nvidia Corp. NVDA shares are trading higher Friday along with the sector. Technology stocks were moving after multiple companies reported having strong earnings.
Nvidia has seen a strong upwards move all week.
Nvidia was up 3.6% at $703.60 at last check. Below is a technical analysis of the chart.
See Also: Analyzing NVIDIA's Unusual Options Activity

Nvidia Daily Chart Analysis:
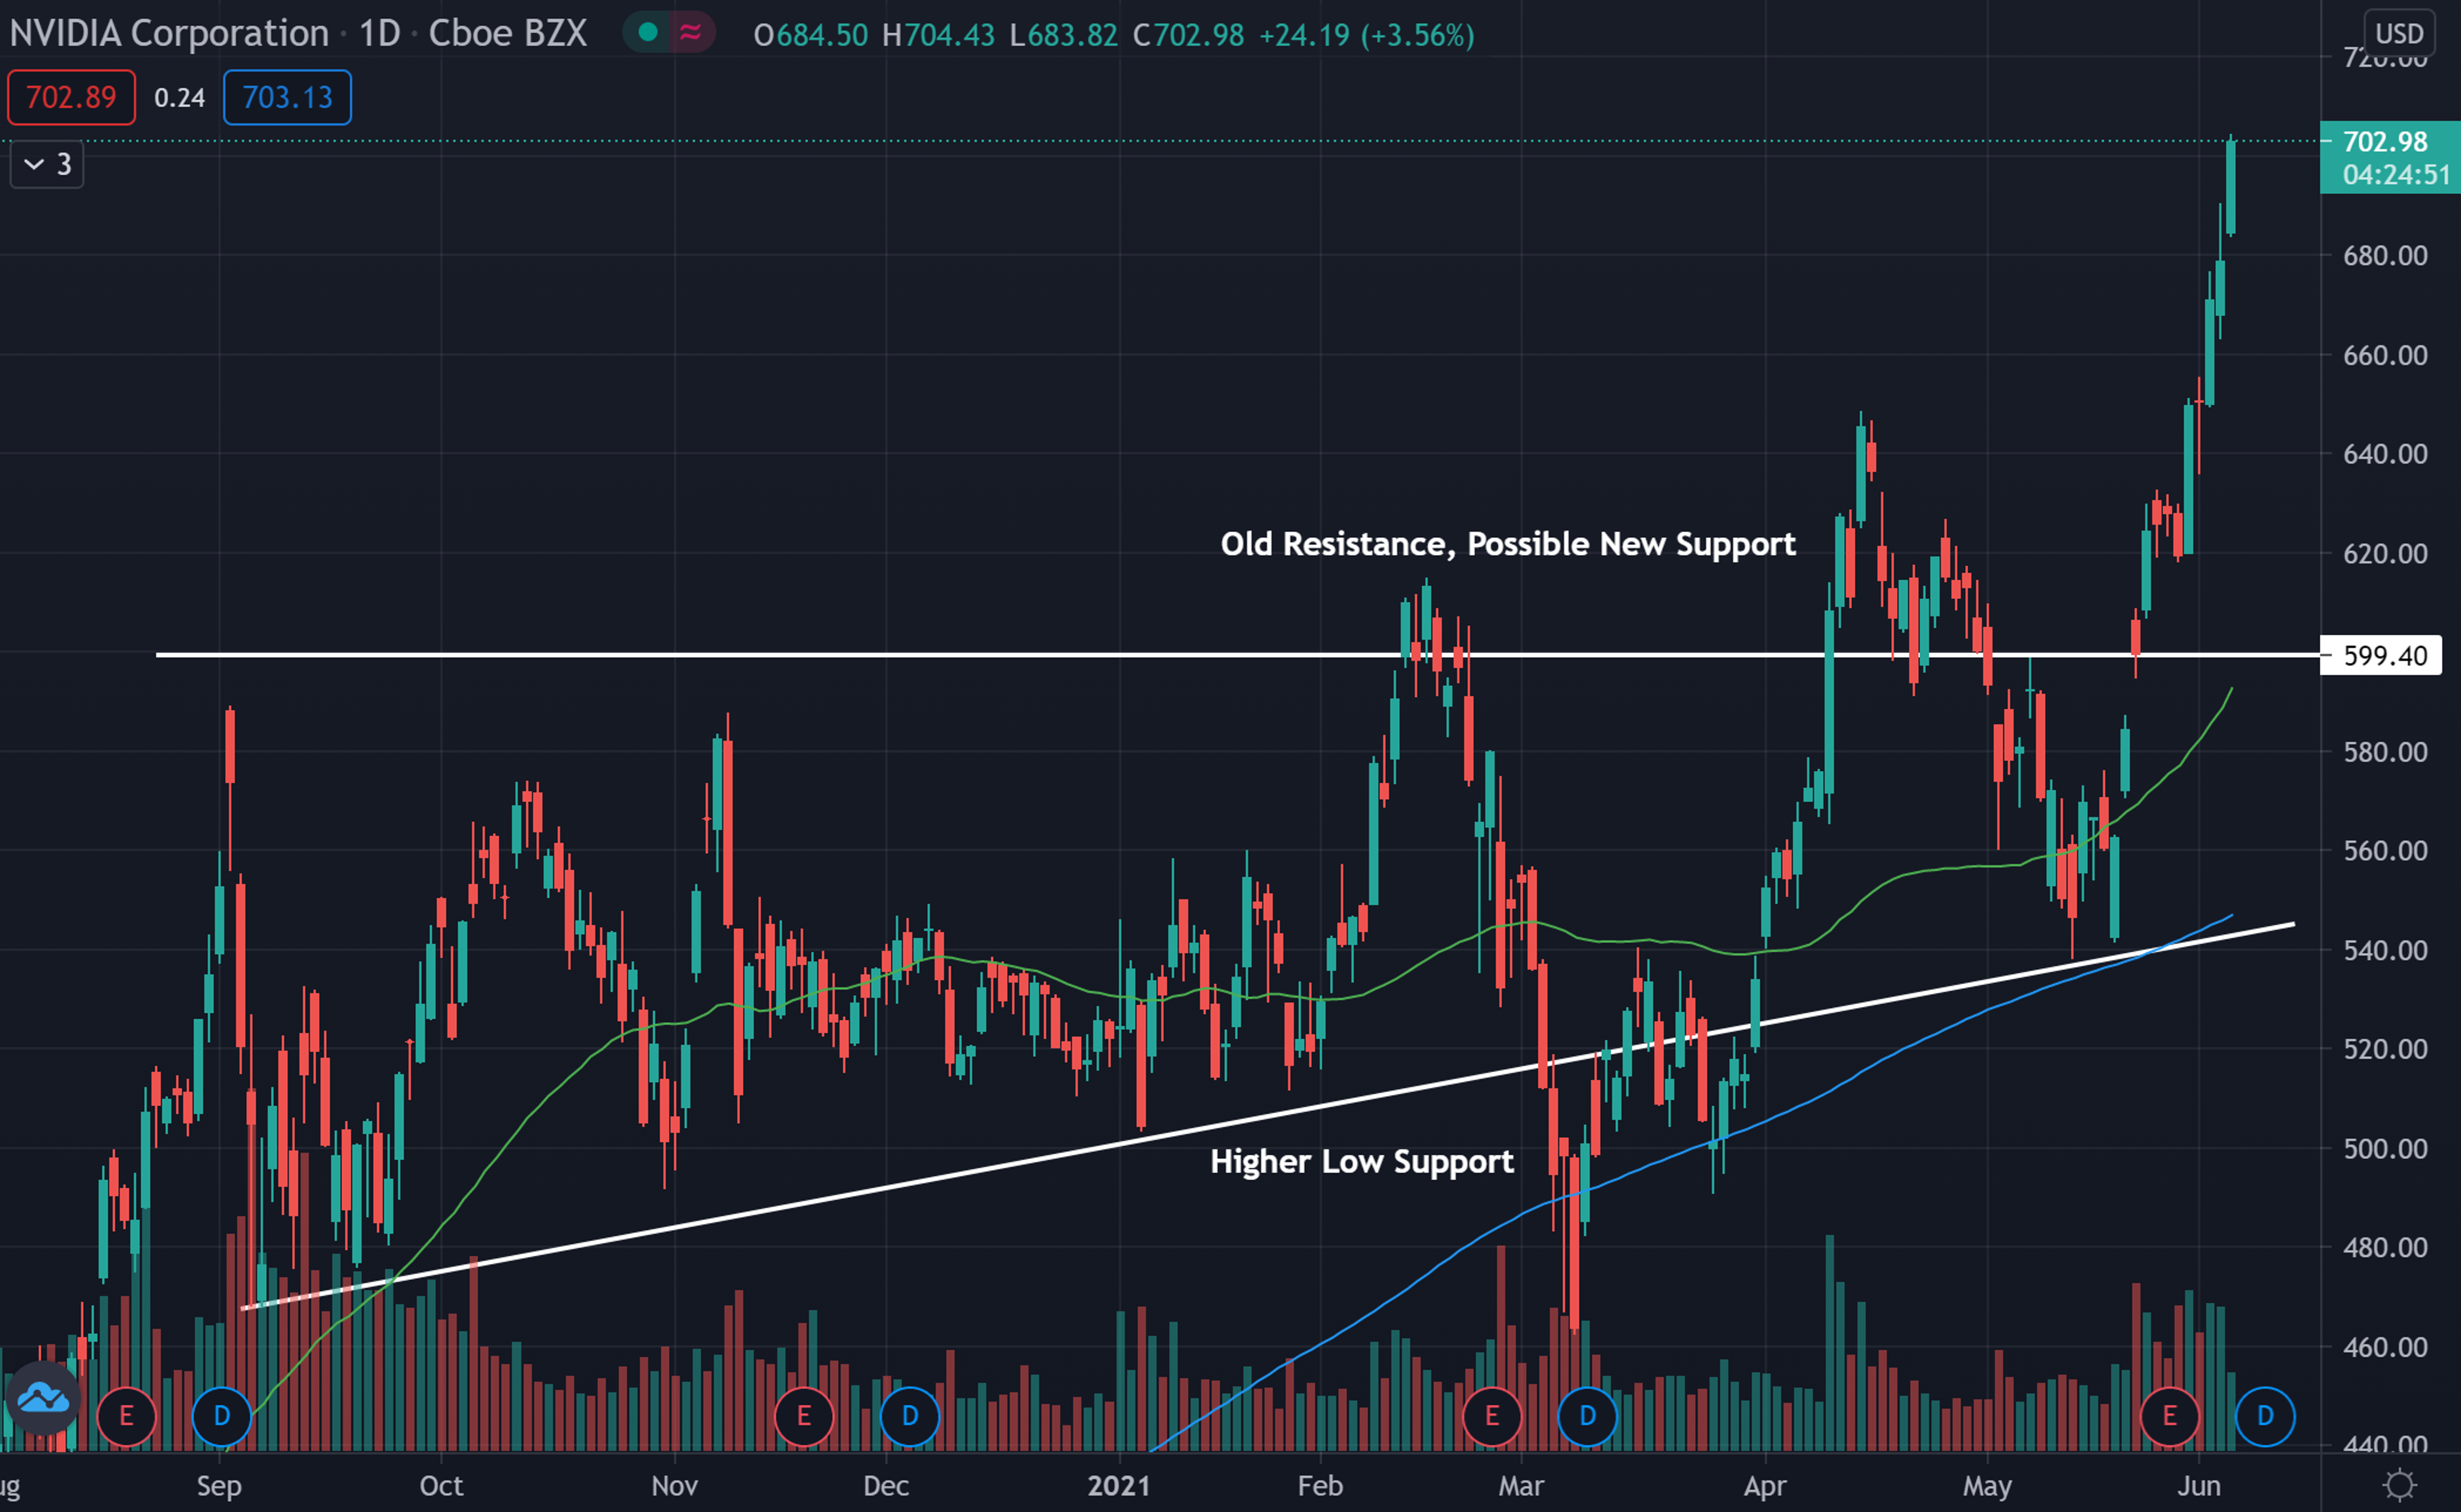
- The chart shows Nvidia recently broke through an old resistance level and has since been rallying.
- The stock is trading above both the 50-day moving average (green), and the 200-day moving average (blue), indicating the sentiment in the stock is most likely bullish.
- Each of these moving averages may act as support in the future.
Key Levels To Watch:
- The $600 level is an area that once held as resistance, but the price recently broke above, and now may hold as a possible area of support.
- The stock has been building higher lows throughout the previous months. These higher lows may hold as support.
What’s Next?
Bullish technical traders would like to see the stock consolidate for a time after seeing a big run up this week. Following consolidation, the stock may be ready to make another move up.
Bearish technical traders would like to see the stock fall back below the higher low trendline. This may cause the stock to turn to a more bearish trend.
© 2024 Benzinga.com. Benzinga does not provide investment advice. All rights reserved.
Trade confidently with insights and alerts from analyst ratings, free reports and breaking news that affects the stocks you care about.

