
GameStop Corp. (NYSE:GME) has been a topic of controversy in 2021. Often trending on fintwit and Reddit, the wild moves in GameStop’s stock were intensified by finance celebrities, such as Dave Portnoy and Chamath Palihapitiya, using their social media platforms to bring the Wall Street versus Main Street brawl mainstream.
The popularity of GameStop’s stock brought in massive volume as retail traders purchased large amounts of shares and large hedge funds were forced to cover short positions.
Volume analysis is one indicator that can be used to signal reversal patterns on a chart. Although there are a number of ways volume can be analyzed to indicate possible future price action, one method is monitoring increasing or decreasing volume across a period of time.
See Also: GameStop (Finally?) Intends To Elect Ryan Cohen As Chairman
What is Volume: Volume indicates the amount of trading that's taking place on an individual stock. As volume increases price action becomes more volatile and the share price of the stock can increase or decrease more rapidly than what is usual.
Conversely, when the volume on a stock is low the share price remains more stagnant. Short-term traders often prefer to trade stocks with high volume because they can collect larger profits over a shorter period of time.
GameStop’s Volume Analysis: GameStop’s stock shows clear volume patterns in relation to share price.
The large bull volume that appeared from Jan. 13 through to Jan. 26 brought on a whopping 2,332% parabolic move in its share price. But after GameStop’s stock hit an all-time high of $483, it sold off heavily over the course of the following 17 trading sessions.
See also: How to Buy GameStop (GME) Stock
During those trading sessions, however, the daily bear volume decreased, indicating that sellers of the stock were becoming fewer as time went on.
On Feb. 24, after the selling pressure dried up, there was another increase in trading volume and GameStop’s stock shot up another 685% over the course of the following 11 trading days. The pattern then repeated with decreasing bear volume from March 11 onwards.

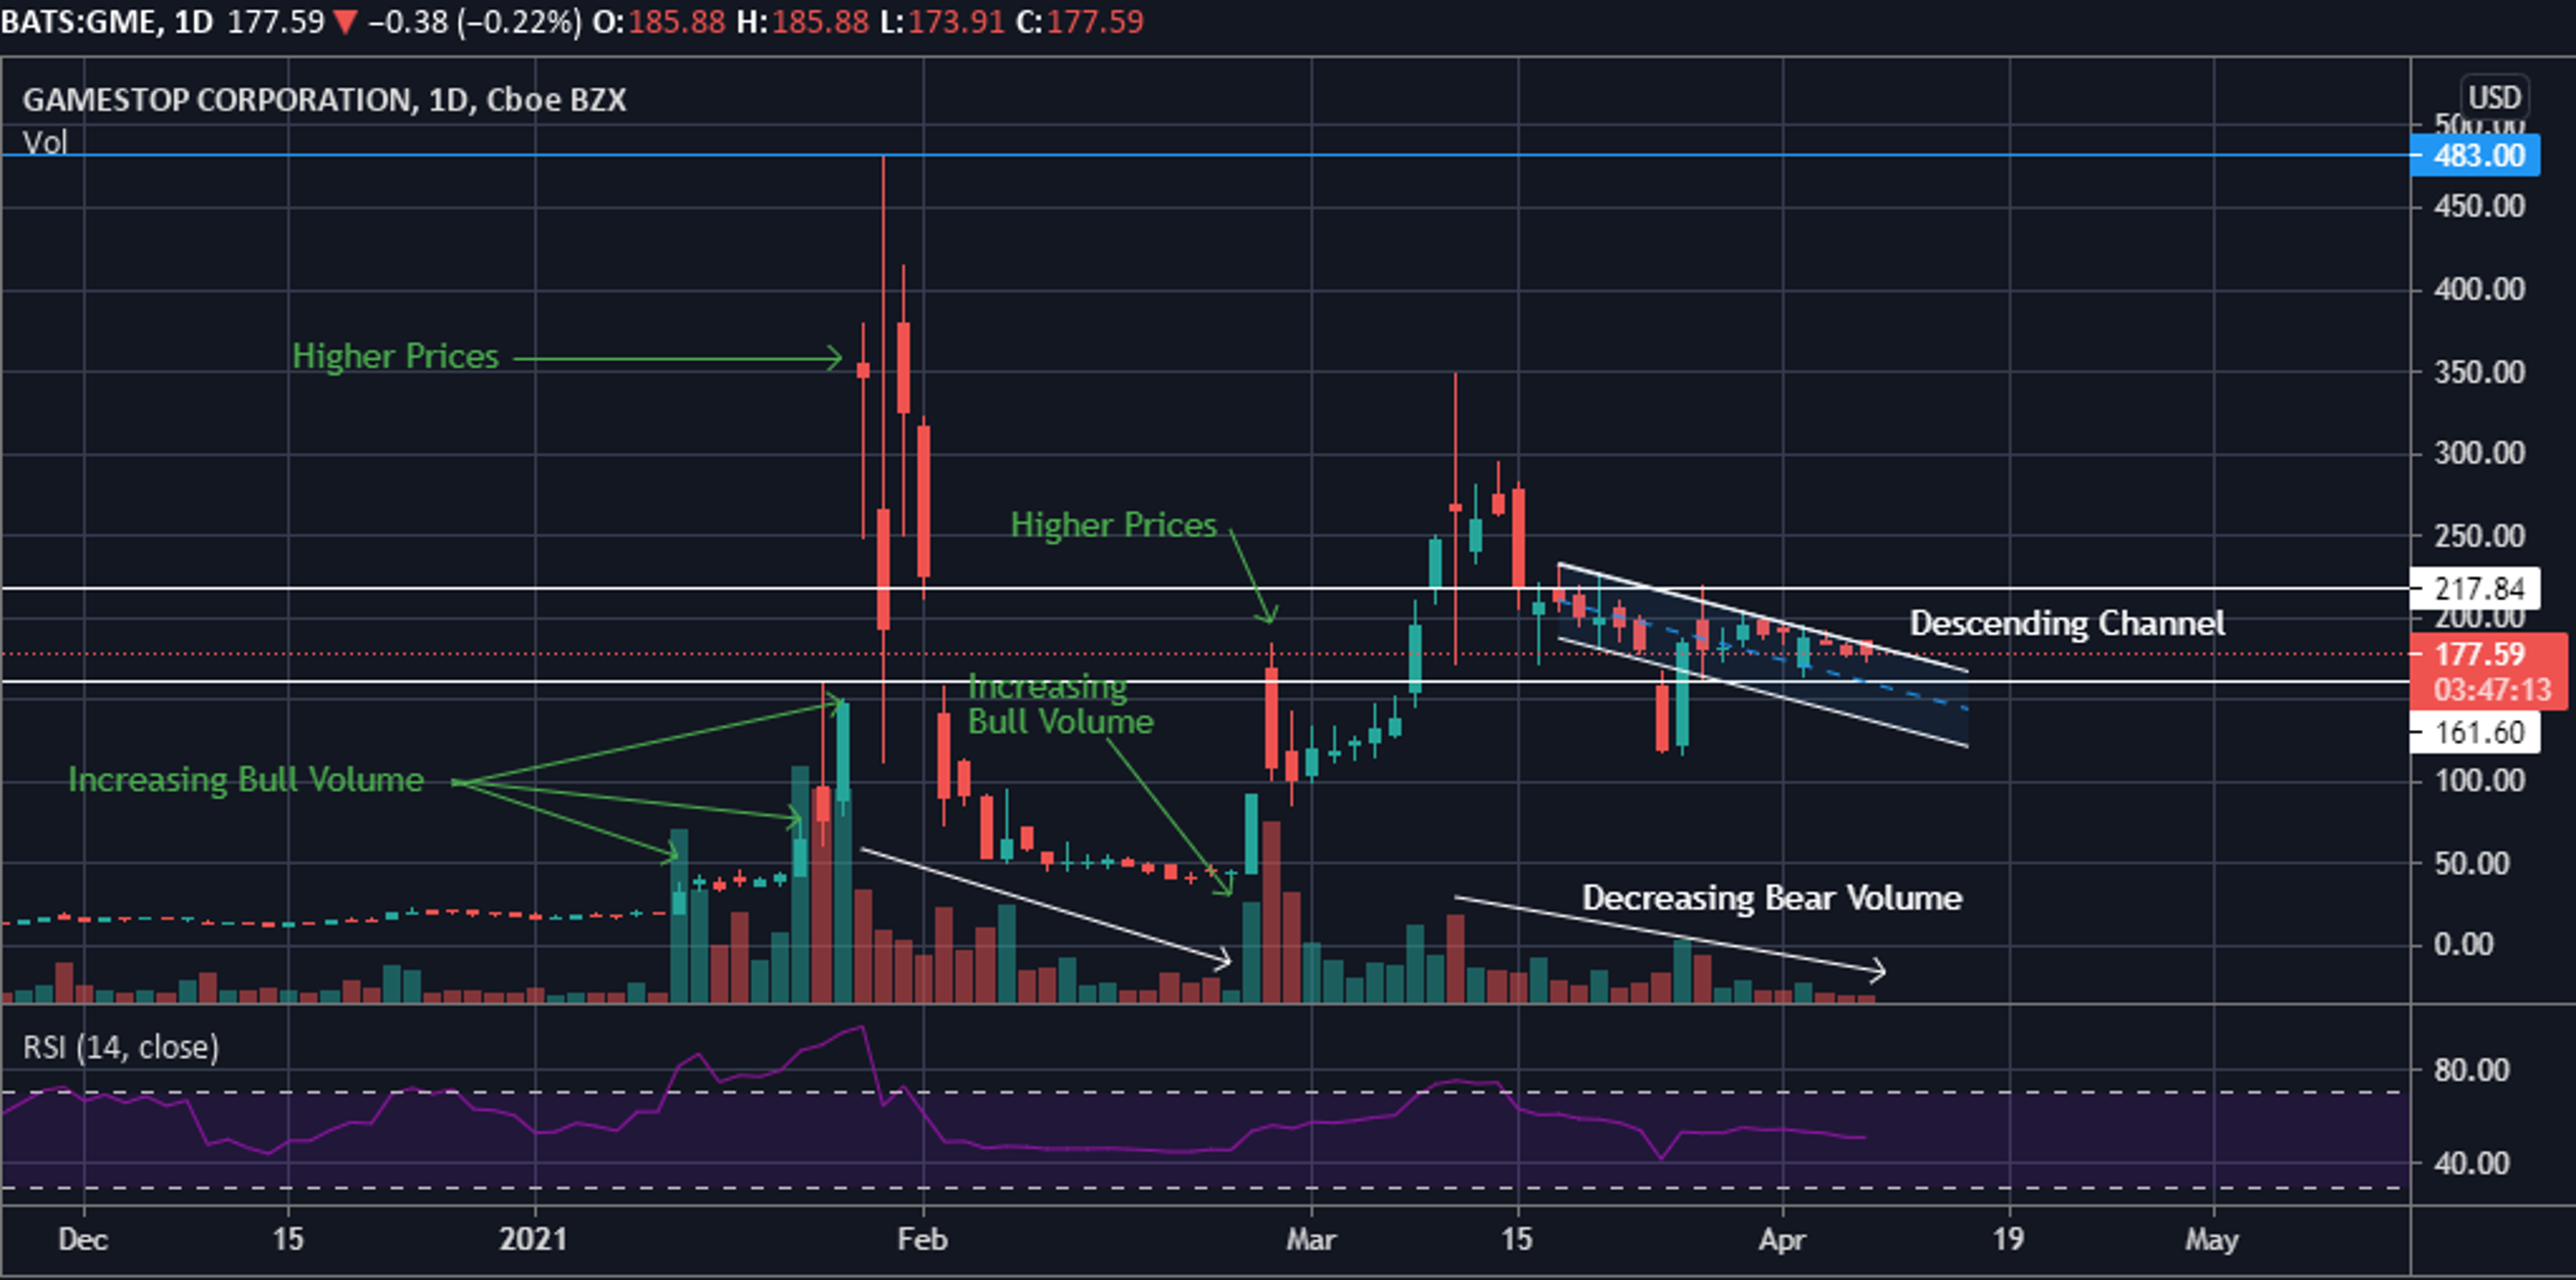
The GameStop Chart: GameStop’s stock may be trading in a bullish descending channel. For the stock to move higher, it would need to break through the upper descending trendline of the pattern, which it did temporarily on Thursday before gravitating back into the channel. If GameStop stock can break above the channel, it could reach its next resistance level of about $217.84.
Bears would like to see GameStop’s stock continue south in the channel or break bearish through its next support level of about $161.60.
© 2025 Benzinga.com. Benzinga does not provide investment advice. All rights reserved.