


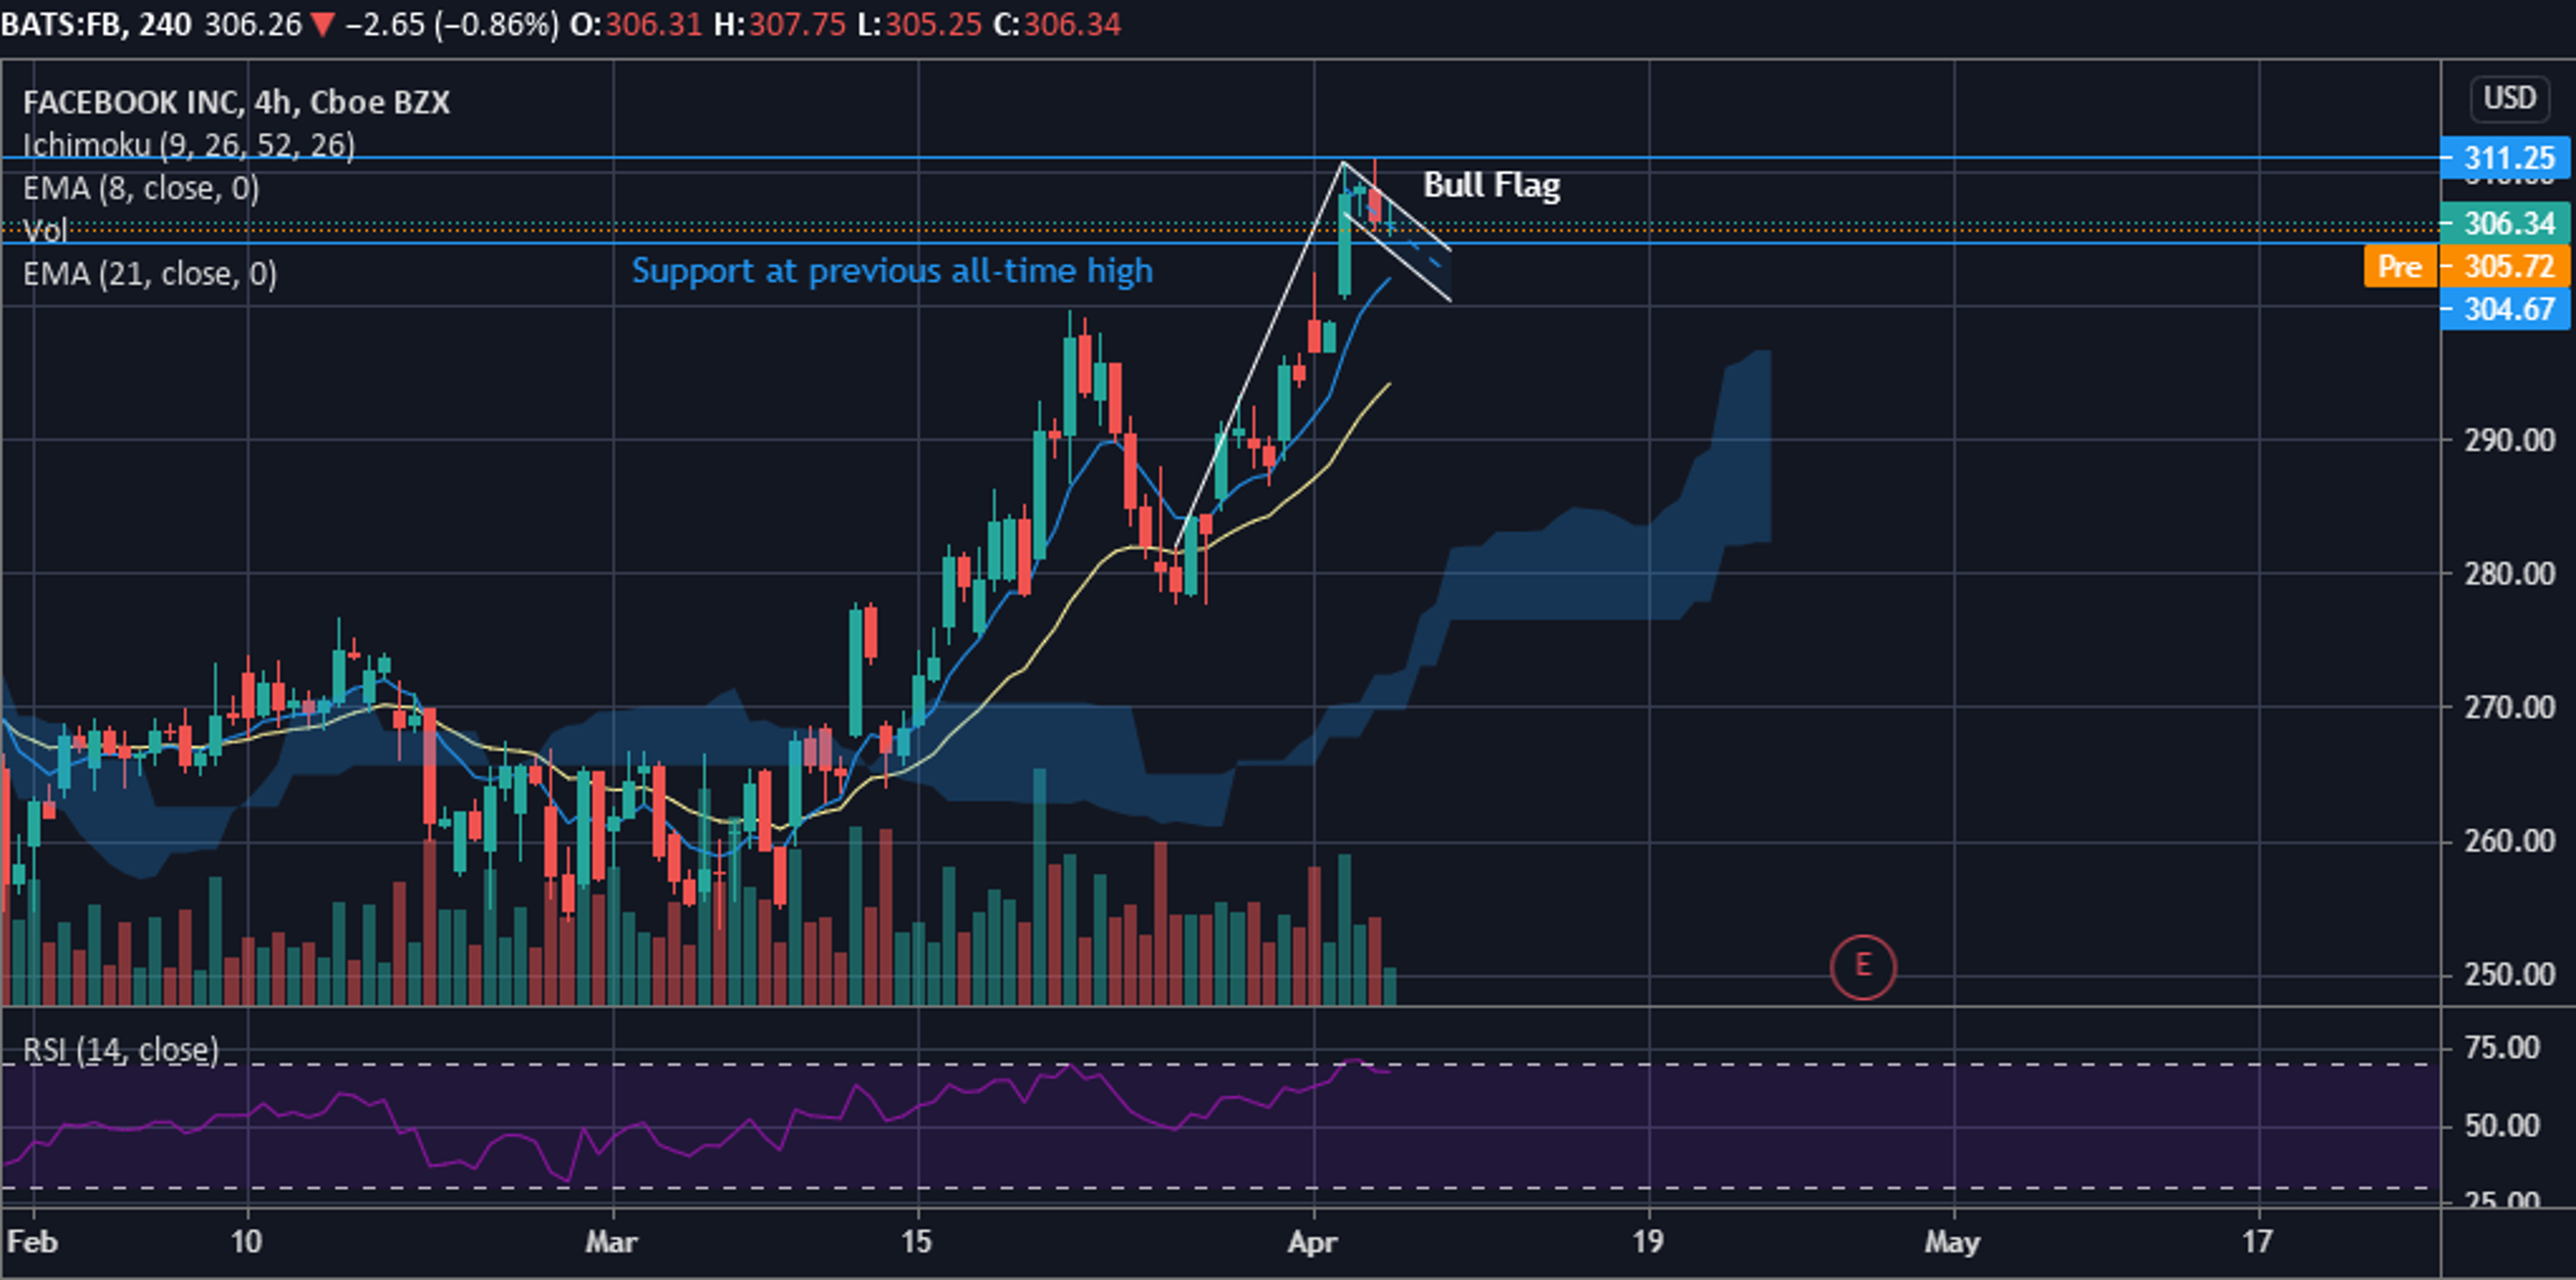
Facebook Inc’s FB stock was the first of the big five tech stocks to turn around amid a seven-week long tech rout. The rout, which started mid-February and lasted throughout March, saw the Nasdaq 100 retrace 12% from its Feb. 16 all-time high.
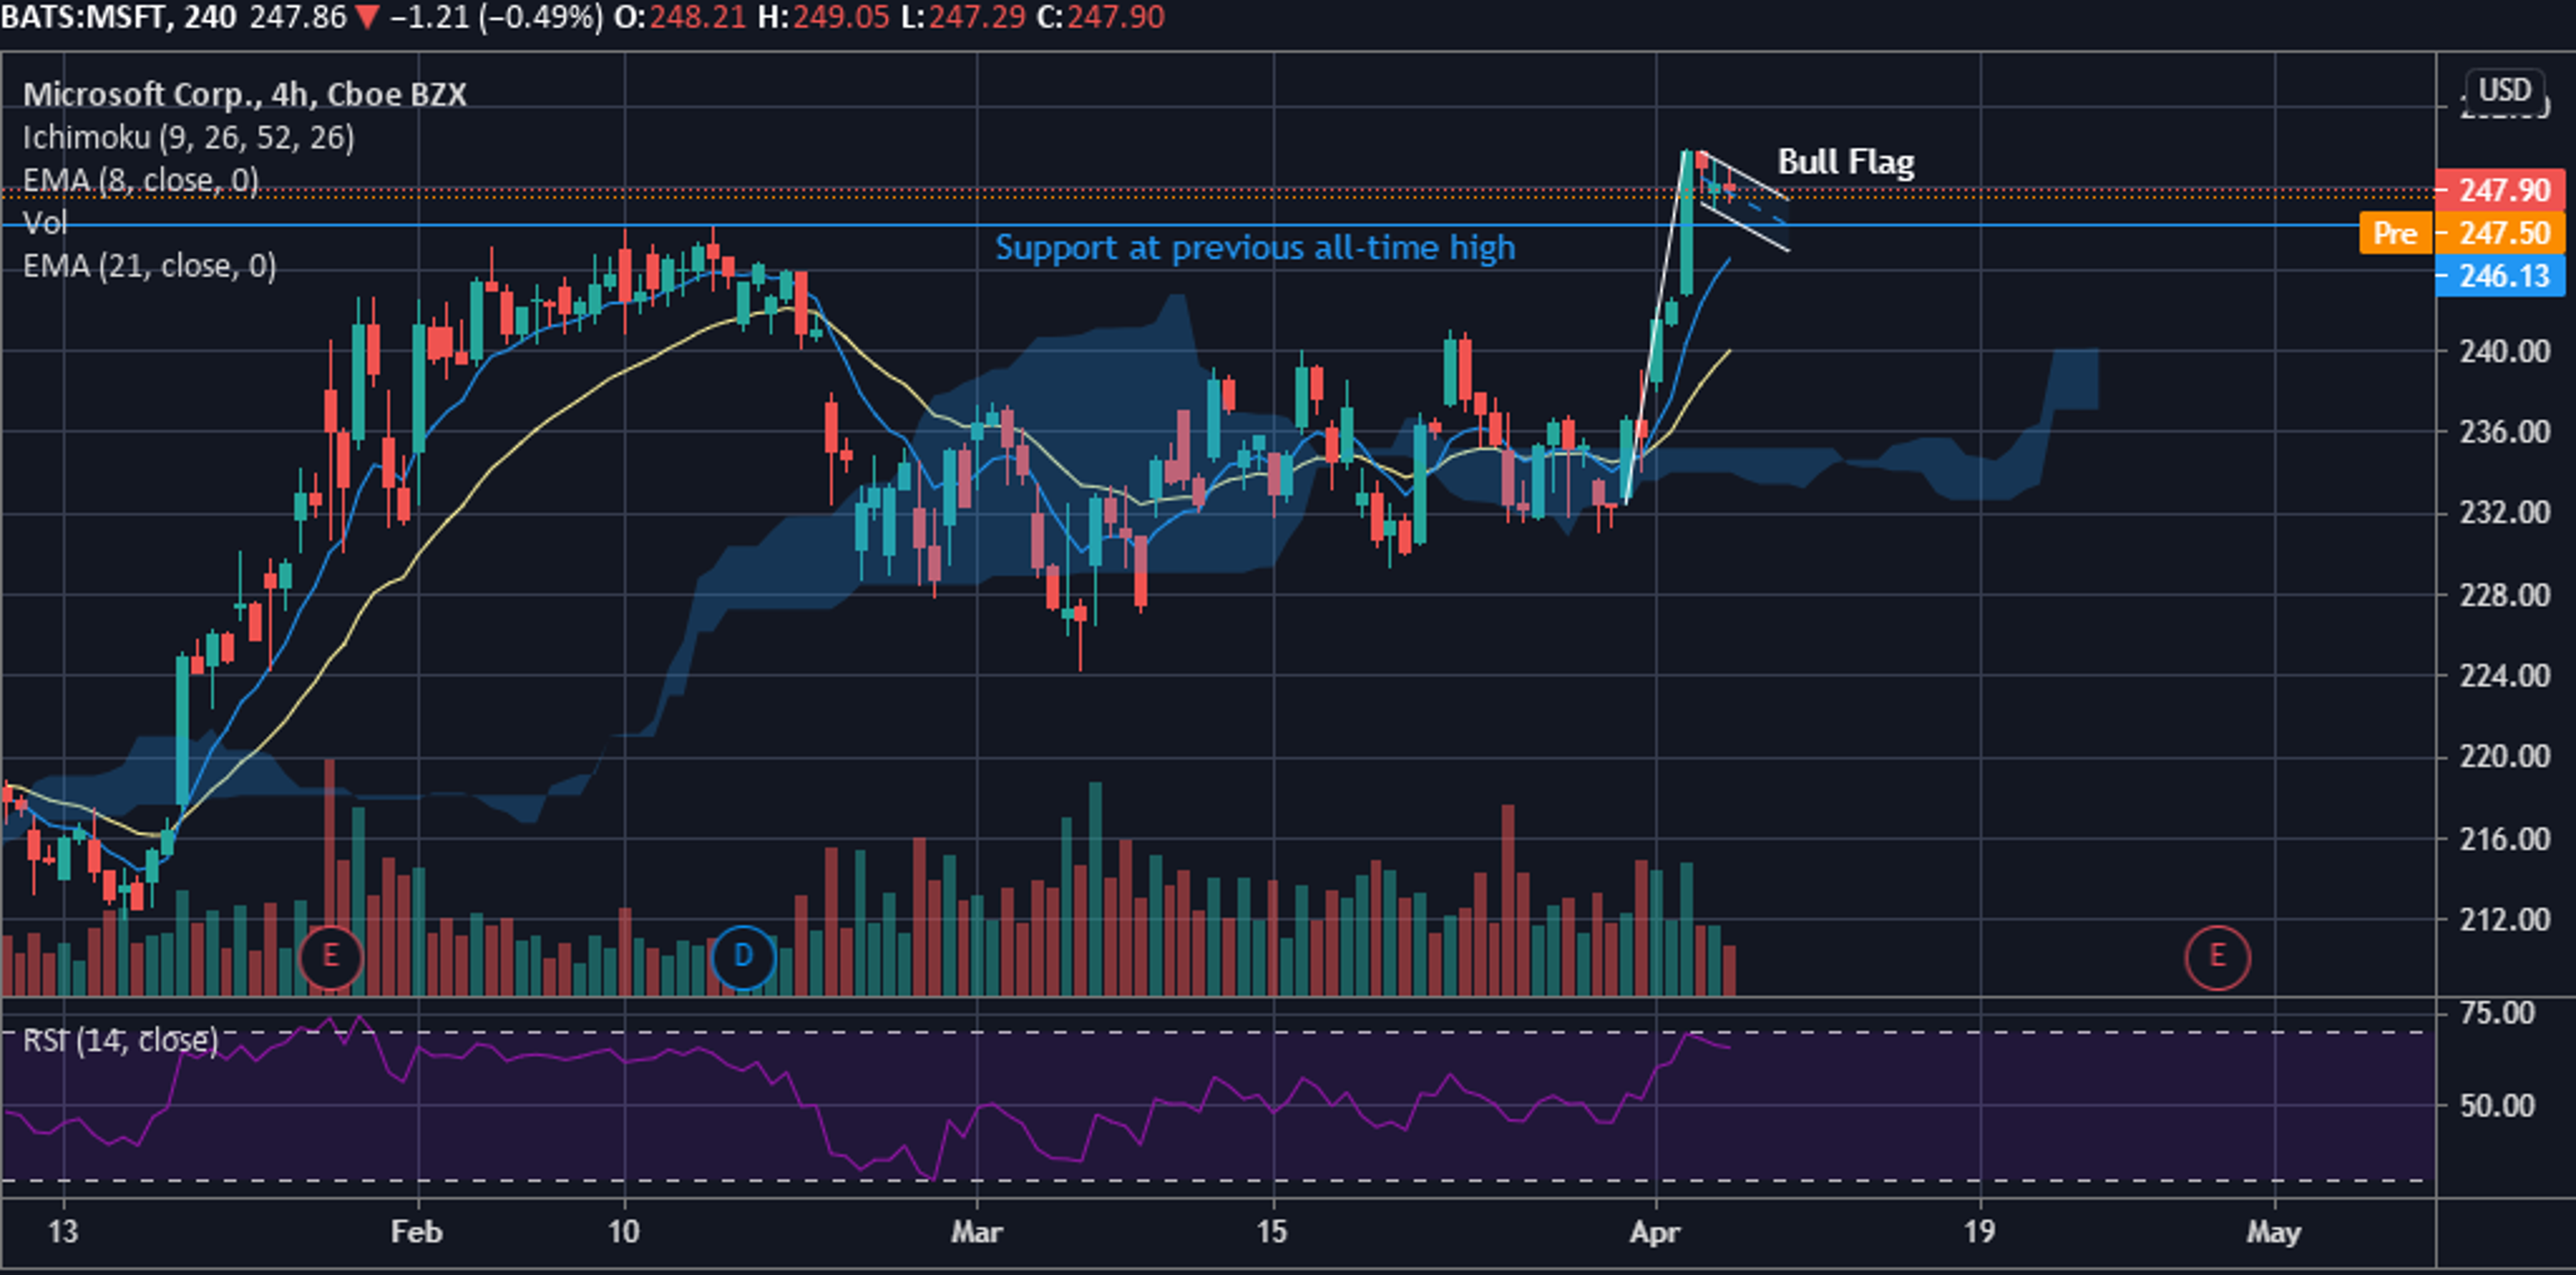
Alphabet Inc GOOG and Microsoft Corporation MSFT shares have caught up, however, and all three stocks made new all-time highs on Monday.
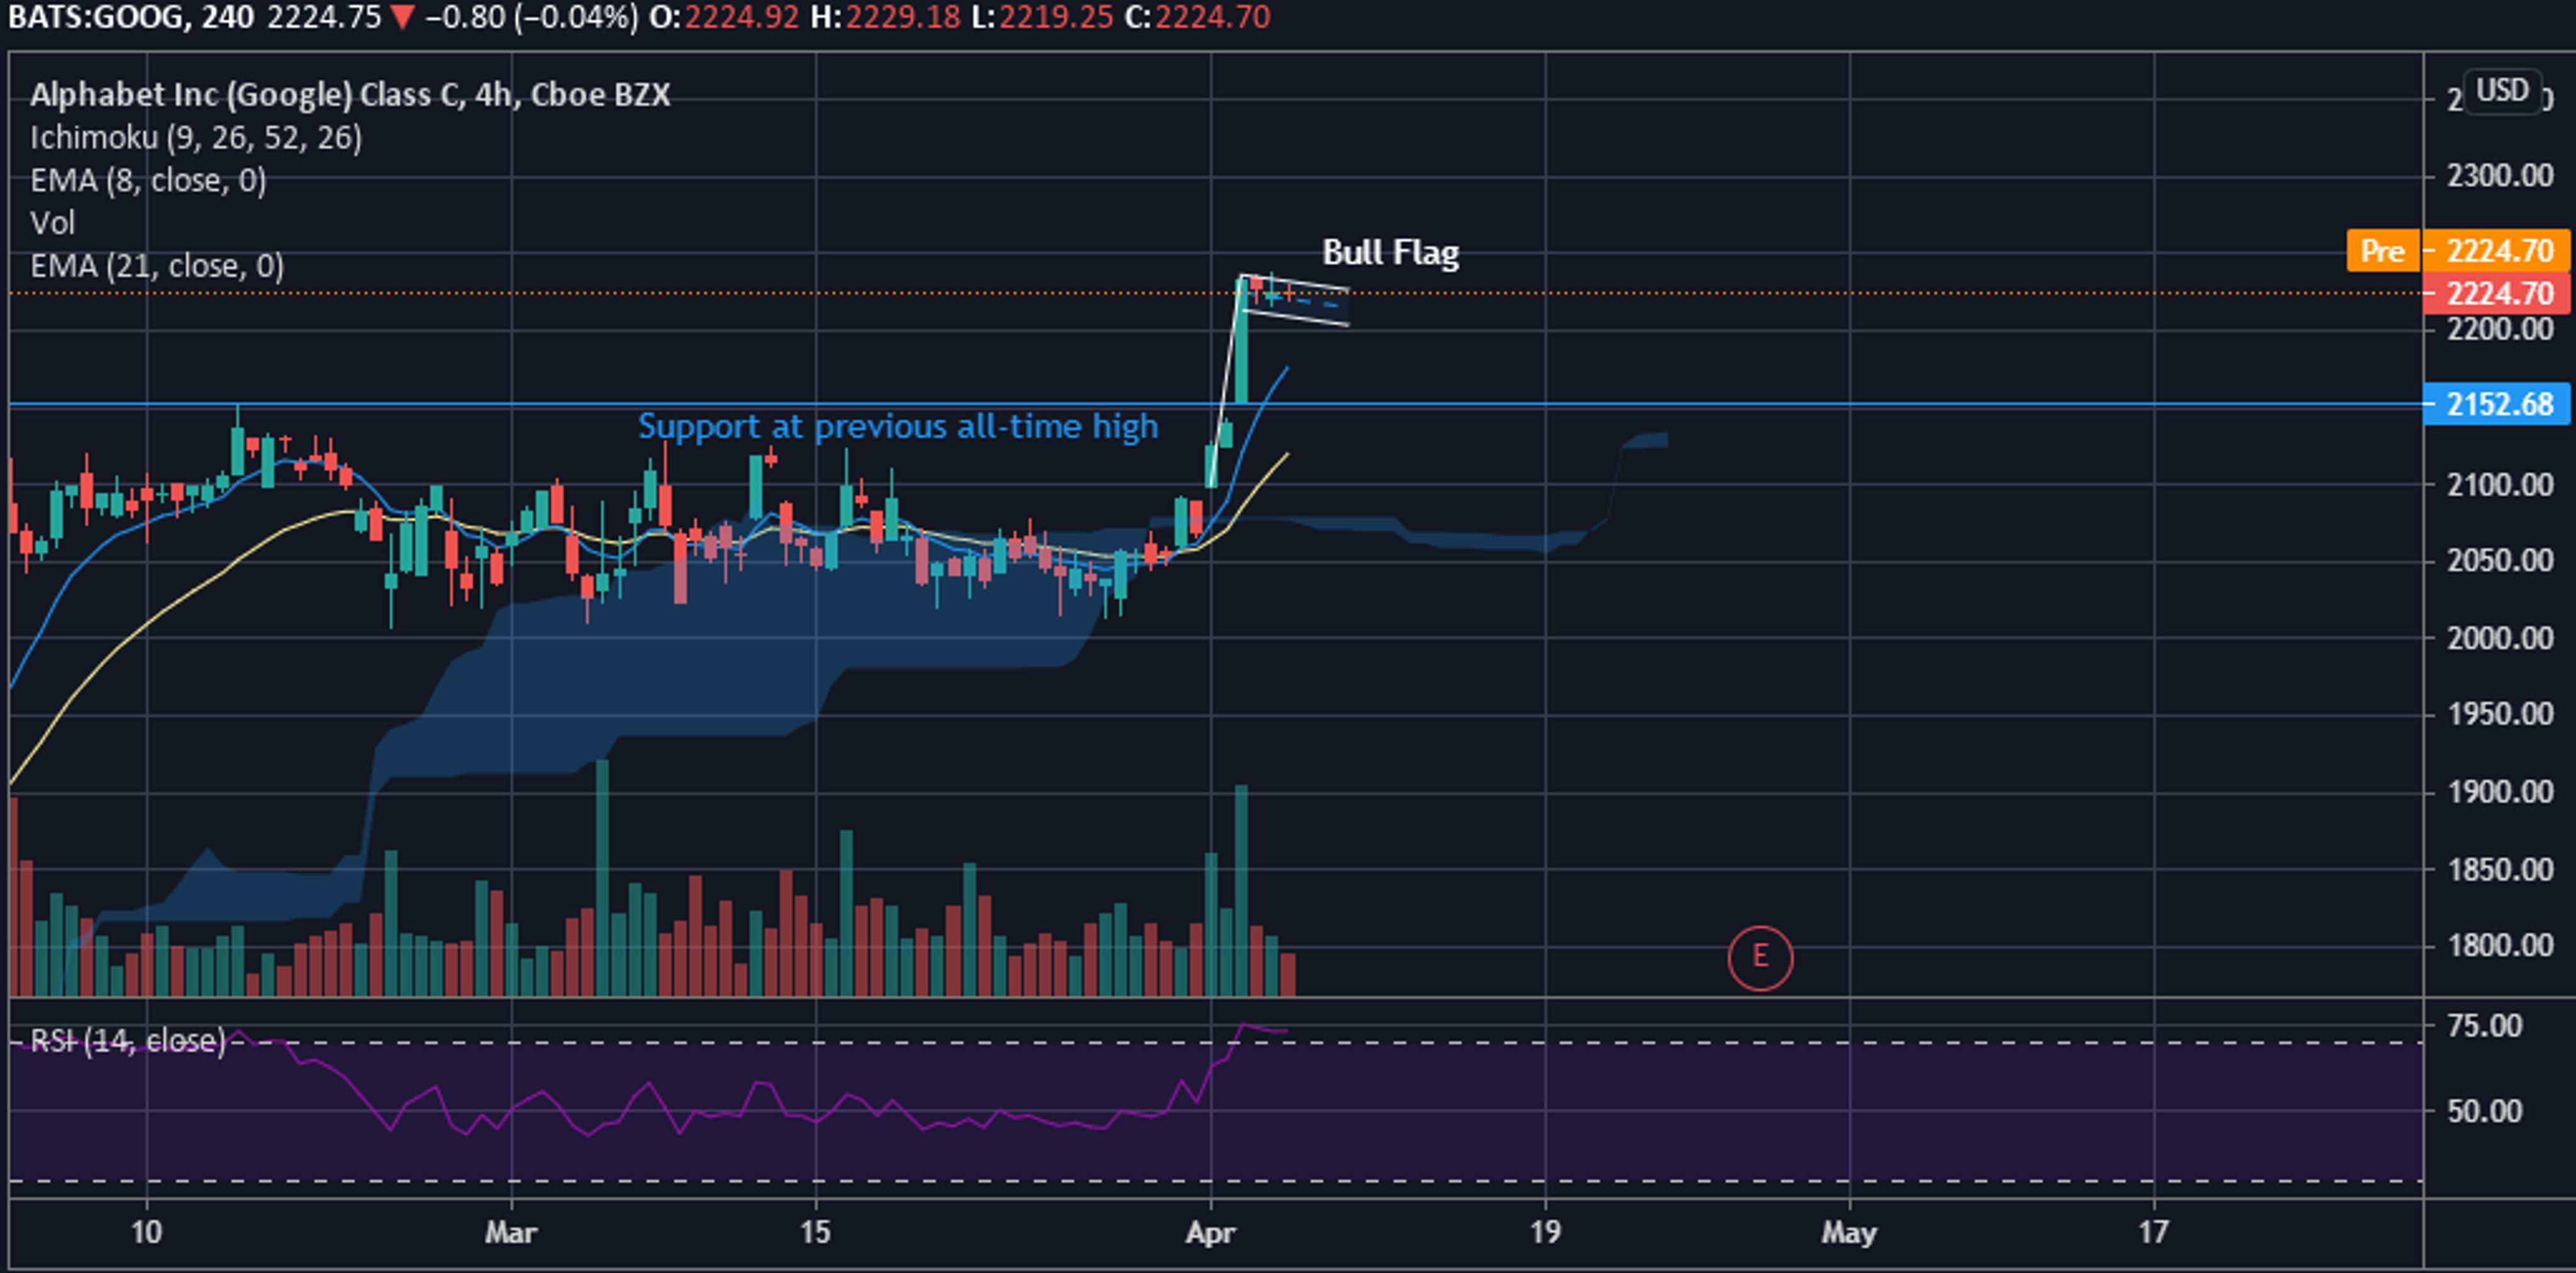
The Daily Chart: The Alphabet, Facebook and Microsoft charts are similar as all three made a new all-time high this week and appear to be consolidating in a bull flag pattern on the four-hour chart.
The Four-Hour Charts: On all three charts the last six candles form a bull flag, which is a very bullish trading pattern. The last three candles from Tuesday’s session form a descending channel that makes up the flag.
The three candles previous to that, from Monday’s trading session, make up the pole of the bull flag pattern with their sharp rising action.
Traders and investors can watch for an upward break of the top line of the descending channel for a large move to the upside. However, if the stocks continue to consolidate traders and investors can zoom out to the daily chart to watch for the bull flag to develop over the coming days.
See Also: Best Blue Chip Stocks
The Alphabet Chart: Alphabet’s stock made a new all-time high of $2,228 on Monday and is now trading in a bull flag pattern on the four-hour chart. Its last candle is an inside bar, meaning the trading range during that candle did not rise above or below the trading range of the previous day. An inside bar can indicate a price move is imminent as it shows the range is tightening.
Alphabet has support at $2,152.68, which is its previous all-time high.

The Facebook Chart: Facebook’s stock made a new all-time high of $311.25 on Tuesday and is trading in a bull flag pattern on the four-hour chart. Facebook’s stock has support at $304.67, which is the previous all-time high.

The Microsoft Chart: Microsoft’s stock, like Alphabet and Facebook, made a new all-time high of $248.96 on Monday and is trading in a bull flag pattern on the four-hour chart. The last candle on the stock’s four-hour chart, like Alphabet, is an inside bar indicating a tightening trading range.
Microsoft has support at $246.13.

© 2024 Benzinga.com. Benzinga does not provide investment advice. All rights reserved.
Trade confidently with insights and alerts from analyst ratings, free reports and breaking news that affects the stocks you care about.

