


The following post was written and/or published as a collaboration between Benzinga’s in-house sponsored content team and a financial partner of Benzinga.
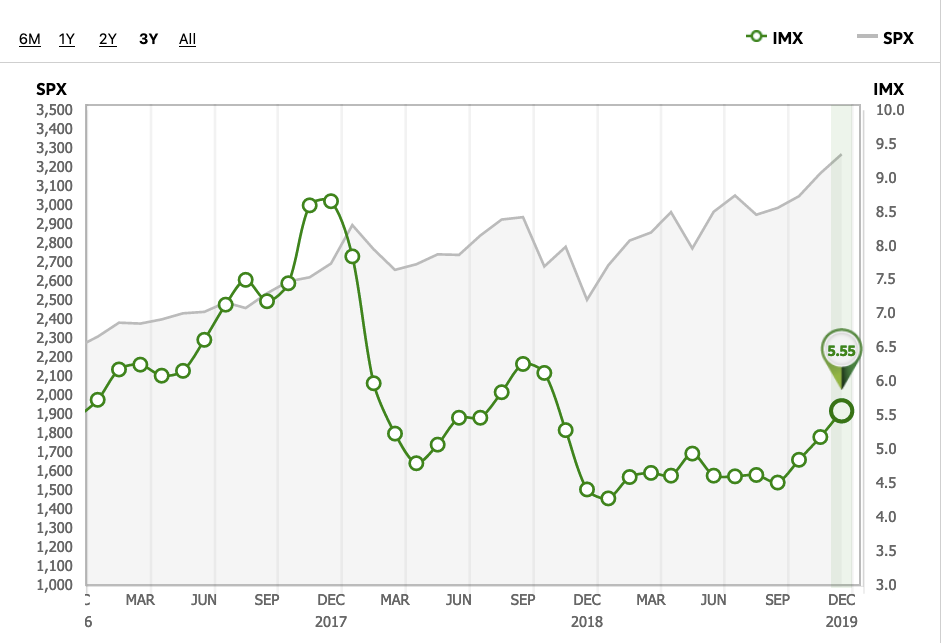
TD Ameritrade clients continued to increase equity market exposure in their accounts during the December IMX period. The IMX increased to 5.55, up 7.35%, from 5.17 the previous period. This marked the highest score in 14 months.
TD Ameritrade clients were net buyers overall, and increased exposure to equity markets during the period. The increase in exposure was mostly driven by net buying in broad-based equity products, including ETFs and mutual funds. Clients were also net buyers of less risky assets, including fixed-income products. Market volatility continued to be light, with the Cboe Volatility Index, or VIX, not registering a closing price above 16 during the period.
The bull market continued during the December IMX period. The S&P 500 and Nasdaq Composite both crossed historic levels at 3,200 and 9,000, respectively, for the first time ever. All three major U.S. indices saw positive gains, with the Nasdaq leading the way, up 3.9% during the period. The S&P increased 3.2%, with the Dow Jones Industrial Average up 2.1%. Helping gains during the period was an announcement that the U.S. and China had reached a phase-one trade agreement, aimed at halting the ongoing trade war. The Federal Reserve also held its benchmark interest rate steady after lowering it the previous three meetings, and indicated no desire to raise it anytime soon. Data also signaled an improvement in the Chinese economy, adding to optimism that risks to global financial markets may be diminishing.
Trading
TD Ameritrade clients found some names to buy during the December IMX period. Walt Disney Company DIS traded lower as "Star Wars: The Rise of Skywalker" hit theaters, but sales lagged earlier installments in the series sending the stock lower. DIS was net bought for the ninth month in a row on the weakness. Microsoft Corporation MSFT was net bought as the stock reached an all-time high during the period following an analyst upgrade. Home Depot Inc. HD saw some volatility during the period as investors questioned the company's investment program to improve the customer shopping experience, and was a net buy. Occidental Petroleum Corp. OXY was net bought after OPEC announced it had struck a deal with allies to deepen their output cuts. Boeing Co. BA announced the resignation of its CEO as the company tries to recover from the 737 MAX fallout, and was net bought as the stock traded lower.
Additional popular names bought include Marvell Tech Group Ltd. MRVL, Peloton Interactive Inc. PTON, and Bristol-Myers Squibb Co. BMY.
TD Ameritrade clients once again sold some names on strength. Facebook Inc. FB reached a 52-week high during the period as the company announced additional measures to insure the integrity of advertising on its platform and was net sold. Alibaba Group Holding Ltd. BABA was net sold as the company announced its Ant Financial Services Group would provide investment advisory services to Chinese retail investors and reached a 52-week high. Johnson & Johnson JNJ hit a 52-week high and was net sold as it announced the acquisition of Taris Biomedical, which is developing drug delivery technology for the treatment of bladder diseases including cancer. Citigroup Inc. C was net sold for the third month in a row as the stock reached a 52-week high after receiving an analyst upgrade. Netflix Inc. NFLX reported healthy growth outside the U.S. and was net sold as the stock traded at prices not seen since July.
Additional names sold include Square Inc. SQ, Gilead Sciences Inc. GILD, and Iqiyi Inc. IQ.
Inclusion of specific security names in this commentary does not constitute a recommendation from TD Ameritrade to buy, sell, or hold.
Historical Overview
TD Ameritrade's Investor Movement Index (IMX) has generally correlated with the S&P 500 as clients react to equity price movements, but the index has gone through uncorrelated periods.
Beginning in January 2010, when TD Ameritrade started tracking the IMX, the index rose with equity markets until April 2010, when it peaked at 5.40. In May 2010 investors experienced the "Flash Crash" and the IMX began a sharp downward trend. The IMX didn't reach 5.00 again until the S&P 500 was well above April 2010 levels. The index eventually peaked at 5.56 in June 2011. This peak was immediately followed by a plunge in equity markets, and in the IMX, as the media was dominated by the U.S. debt ceiling debate, S&P downgrade of U.S. debt, and European debt concerns. The S&P 500 began to recover in the fall of 2011, but the IMX continued to decline until it reached a new low at the time in January 2012.
As the S&P 500 began to sustain an upward trend in early 2012, the IMX started to rise. In 2013, as economic conditions improved and the S&P 500 climbed to record levels, the IMX rose to the high end of its historical range, finishing 2013 at 5.62, and continued to rise in 2014 amid geopolitical tensions related to Ukraine and the Middle East, until seeing slight declines in October and November.
By the middle of 2015 the IMX had seen increases, as equity market volatility had reduced to near historical levels while the market continued its upward trend. As 2015 ended its third quarter, volatility had returned to markets, as global economic concerns and speculation around the timing and trajectory of Federal Reserve rate increases seemed to rattle overall equity markets. This uncertainty continued to play a role in the equity markets through the fourth quarter of 2015 and into early 2016. The volatility accompanying this uncertainty abated in the second quarter of 2016 and remained low until late in the third quarter. Just as it had in 2015, the IMX saw increases mid-year during the period of lower volatility. The IMX continued to climb into the fourth quarter reaching 5.83 in October 2016, its highest point in two years. A brief spike in volatility during November, timed around the U.S. presidential election, coincided with a slight pullback in the IMX, which then ended 2016 at the high end of its historical range.
The IMX started 2017 with an upward trend and reaching an all-time high in March, before pausing in April as lower volatility led to a decrease in the IMX. The momentum resumed in May, with the IMX breaching 7.0 for the first time ever in July of 2017. The IMX took another brief pause in September, before following markets higher and breaching 8.0 for the first time ever in November and ending 2017 at an all-time high. Volatility returned to the markets in early 2018, and the IMX decreased for four consecutive months to start the year. The IMX then rebounded in the spring of 2018, and continued higher during the summer on the back of better-than-expected earnings and increasing equity markets. The IMX headed higher during the fall of 2018 as economic growth increased before heading lower in late 2018 as the Nasdaq Composite entered a bear market to end the year.
Geopolitical issues were in the headlines during early 2019 as the U.S. and China traded tariffs. The IMX rebounded along with equity markets in the spring of 2019 on optimism of a trade deal with China and the unemployment rate nearing a 49-year low. The IMX remained range-bound during the summer of 2019 as trade-related policy concerns led to investors favoring less-risky assets, including fixed-income products. Heading into the fall of 2019, the IMX began to rebound and ended the year at the highest levels in over a year as trade war fears diminished and economic data began to improve globally.
Historical data should not be used alone when making investment decisions. Please consult other sources of information and consider your individual financial position and goals before making an independent investment decision.
All investments involve risk including the possible loss of principal. Please consider all risks and objectives before investing.
Past performance of a security, strategy or index is no guarantee of future results or investment success.
The IMX is not a tradable index.
The IMX should not be used as an indicator or predictor of future client trading volume or financial performance for TD Ameritrade.
The preceding post was written and/or published as a collaboration between Benzinga’s in-house sponsored content team and a financial partner of Benzinga. Although the piece is not and should not be construed as editorial content, the sponsored content team works to ensure that any and all information contained within is true and accurate to the best of their knowledge and research. This content is for informational purposes only and not intended to be investing advice.
© 2024 Benzinga.com. Benzinga does not provide investment advice. All rights reserved.
Trade confidently with insights and alerts from analyst ratings, free reports and breaking news that affects the stocks you care about.

