


Below are five stocks to watch according to VantagePoint, a platform that uses artificial intelligence and intermarket analysis to predict price movement. Today the focus is on steel stocks, which have been on a run to start 2018, and how the breakouts were forecasted back in November.
What's On The Charts
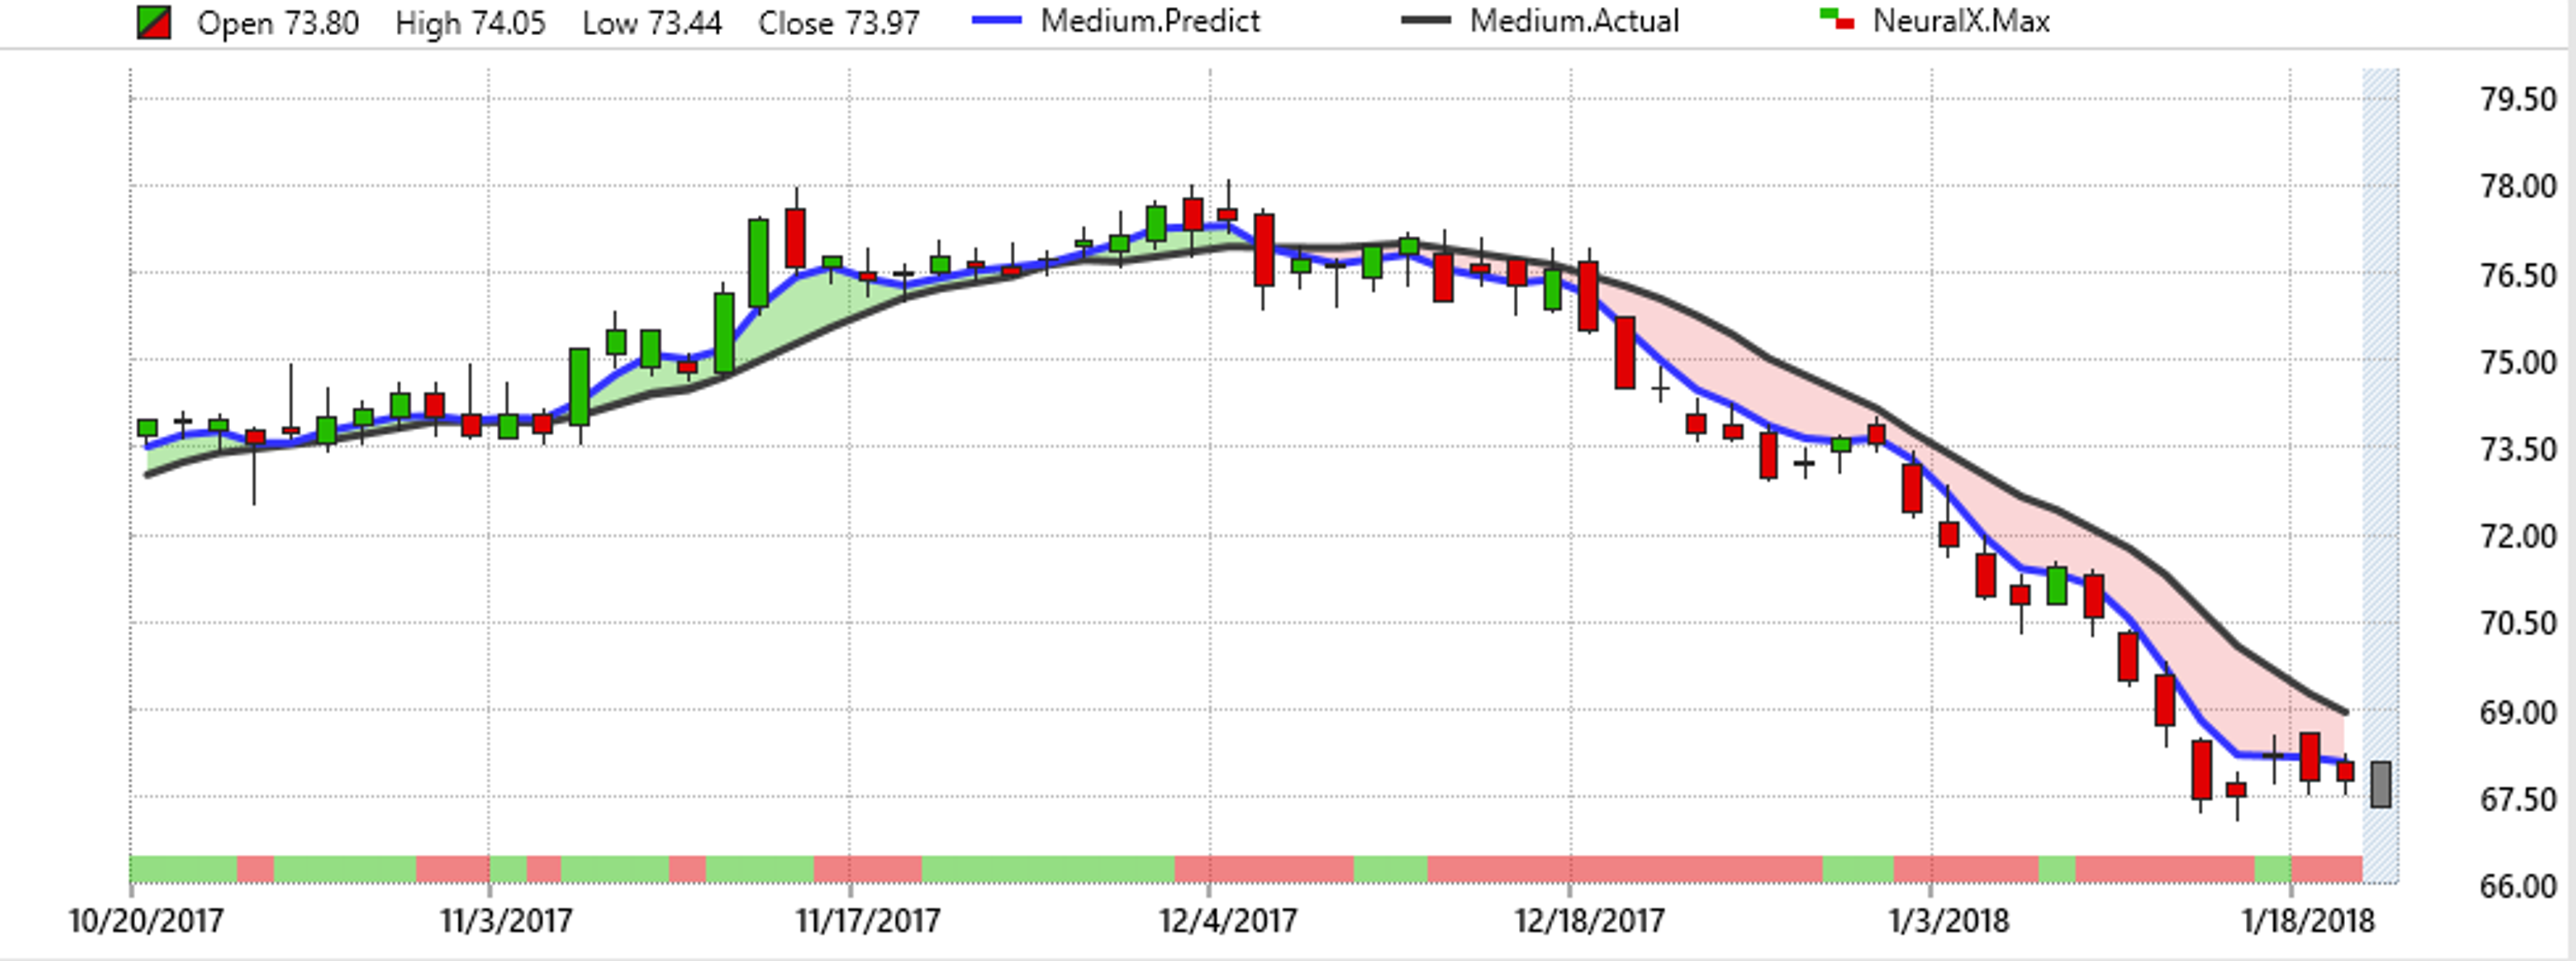
- Each candle on the following stock charts represents one day of trading action.
- The black line on the chart is a simple 10-day moving average.
- The blue line is generated via the AI in VantagePoint's intermarket analysis. It forecasts what the moving average will be 48 hours in advance.
A trend shift is represented by the two lines crossing. As long as the two lines don't cross, the current trend remains intact.
- The red/green bar below the candle chart is a Neural Index. It determines whether a stock will move higher or lower in the coming two days.
This Week's Hot Stocks
Gilead Sciences, Inc. GILD

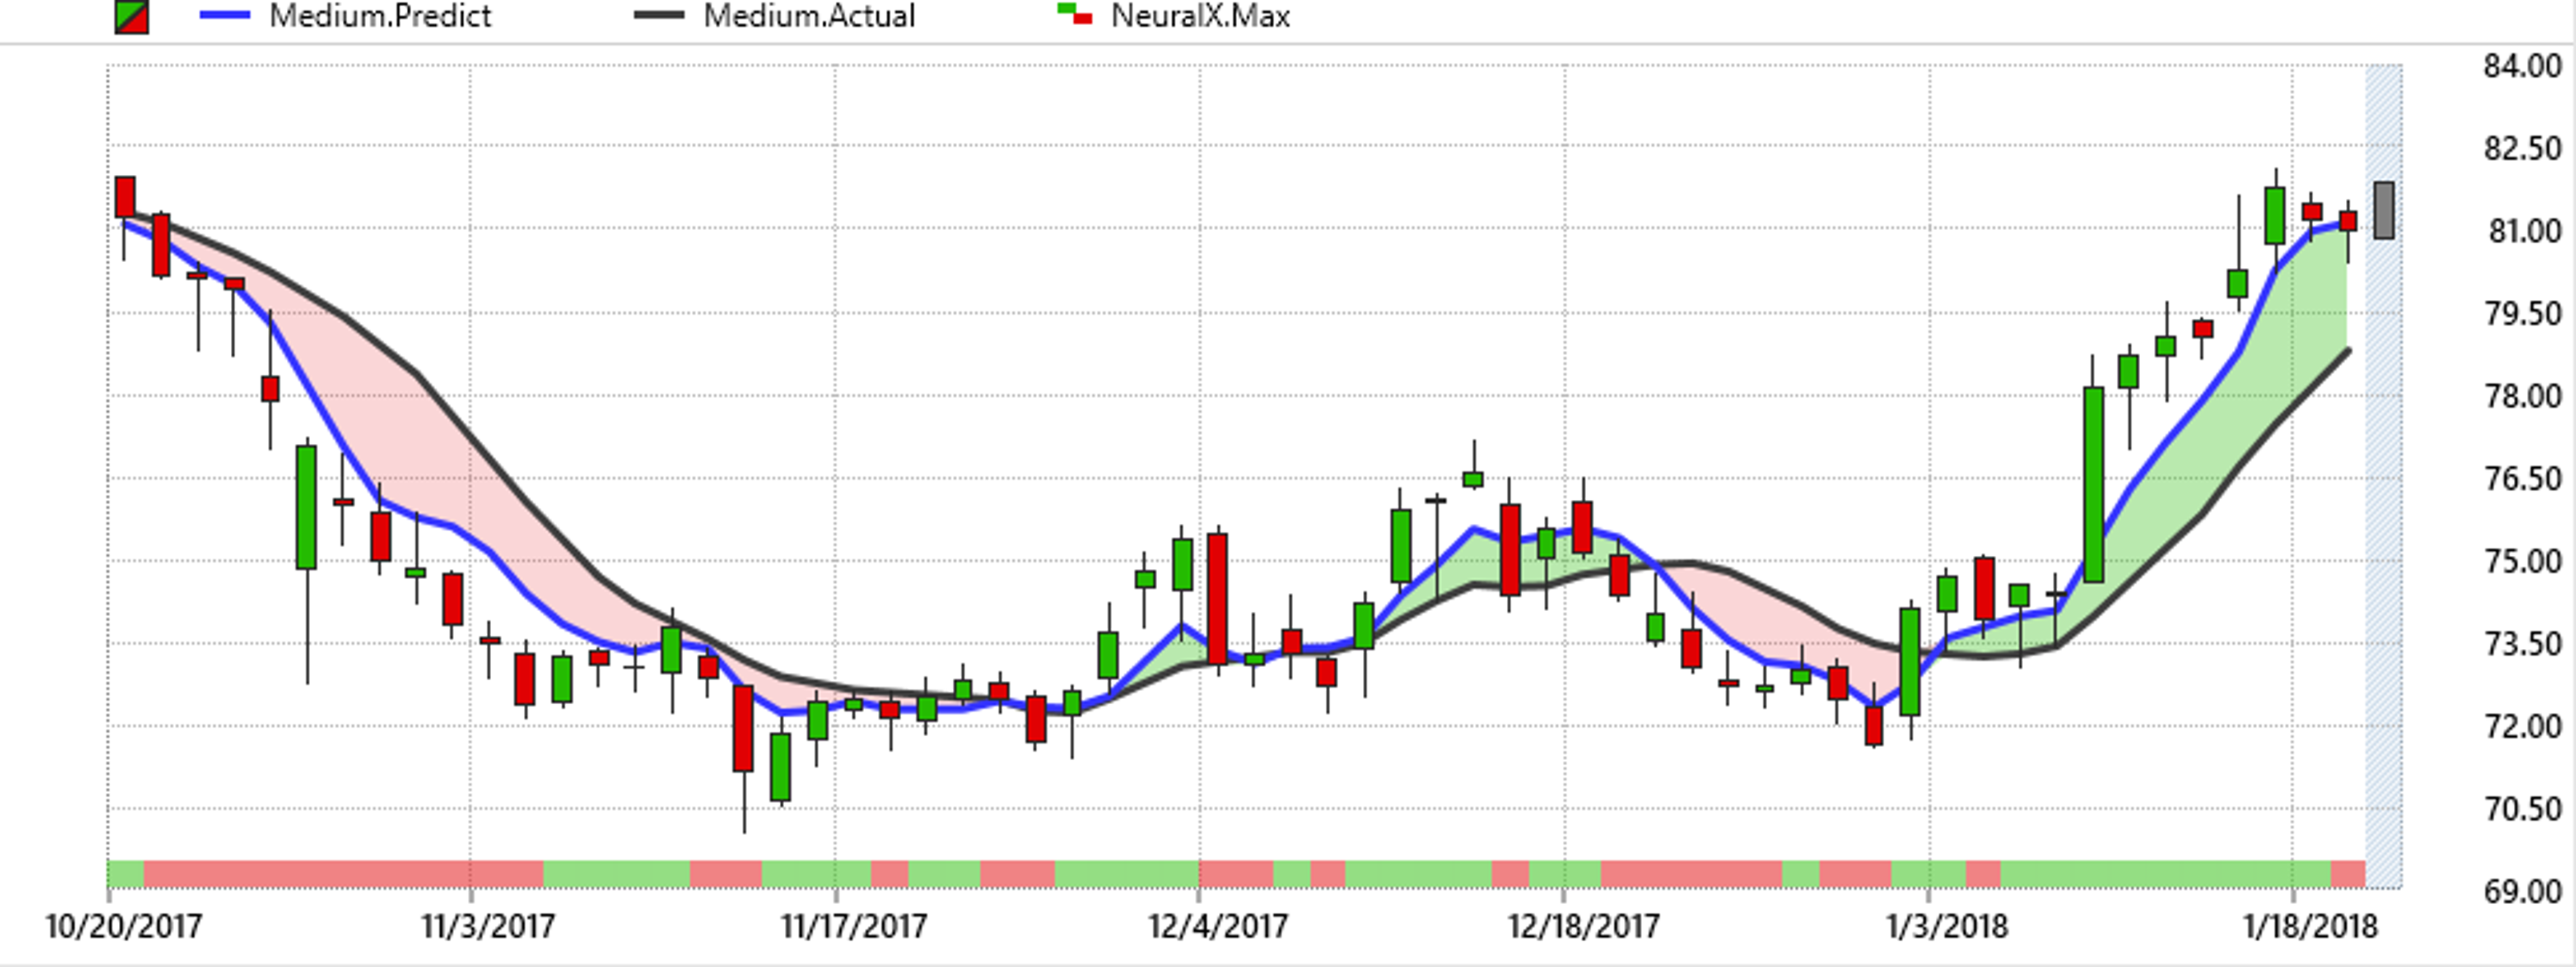
Gilead Sciences had a predictive moving average crossover to the upside right at the start of the year. The blue predicted moving average line crossed over the simple 10-day moving average, making this a bullish crossover. Since then the two lines have only diverged more, indicating the trend has gotten stronger. The stock is up about 13 percent so far in 2018.
Cardinal Health Inc CAH

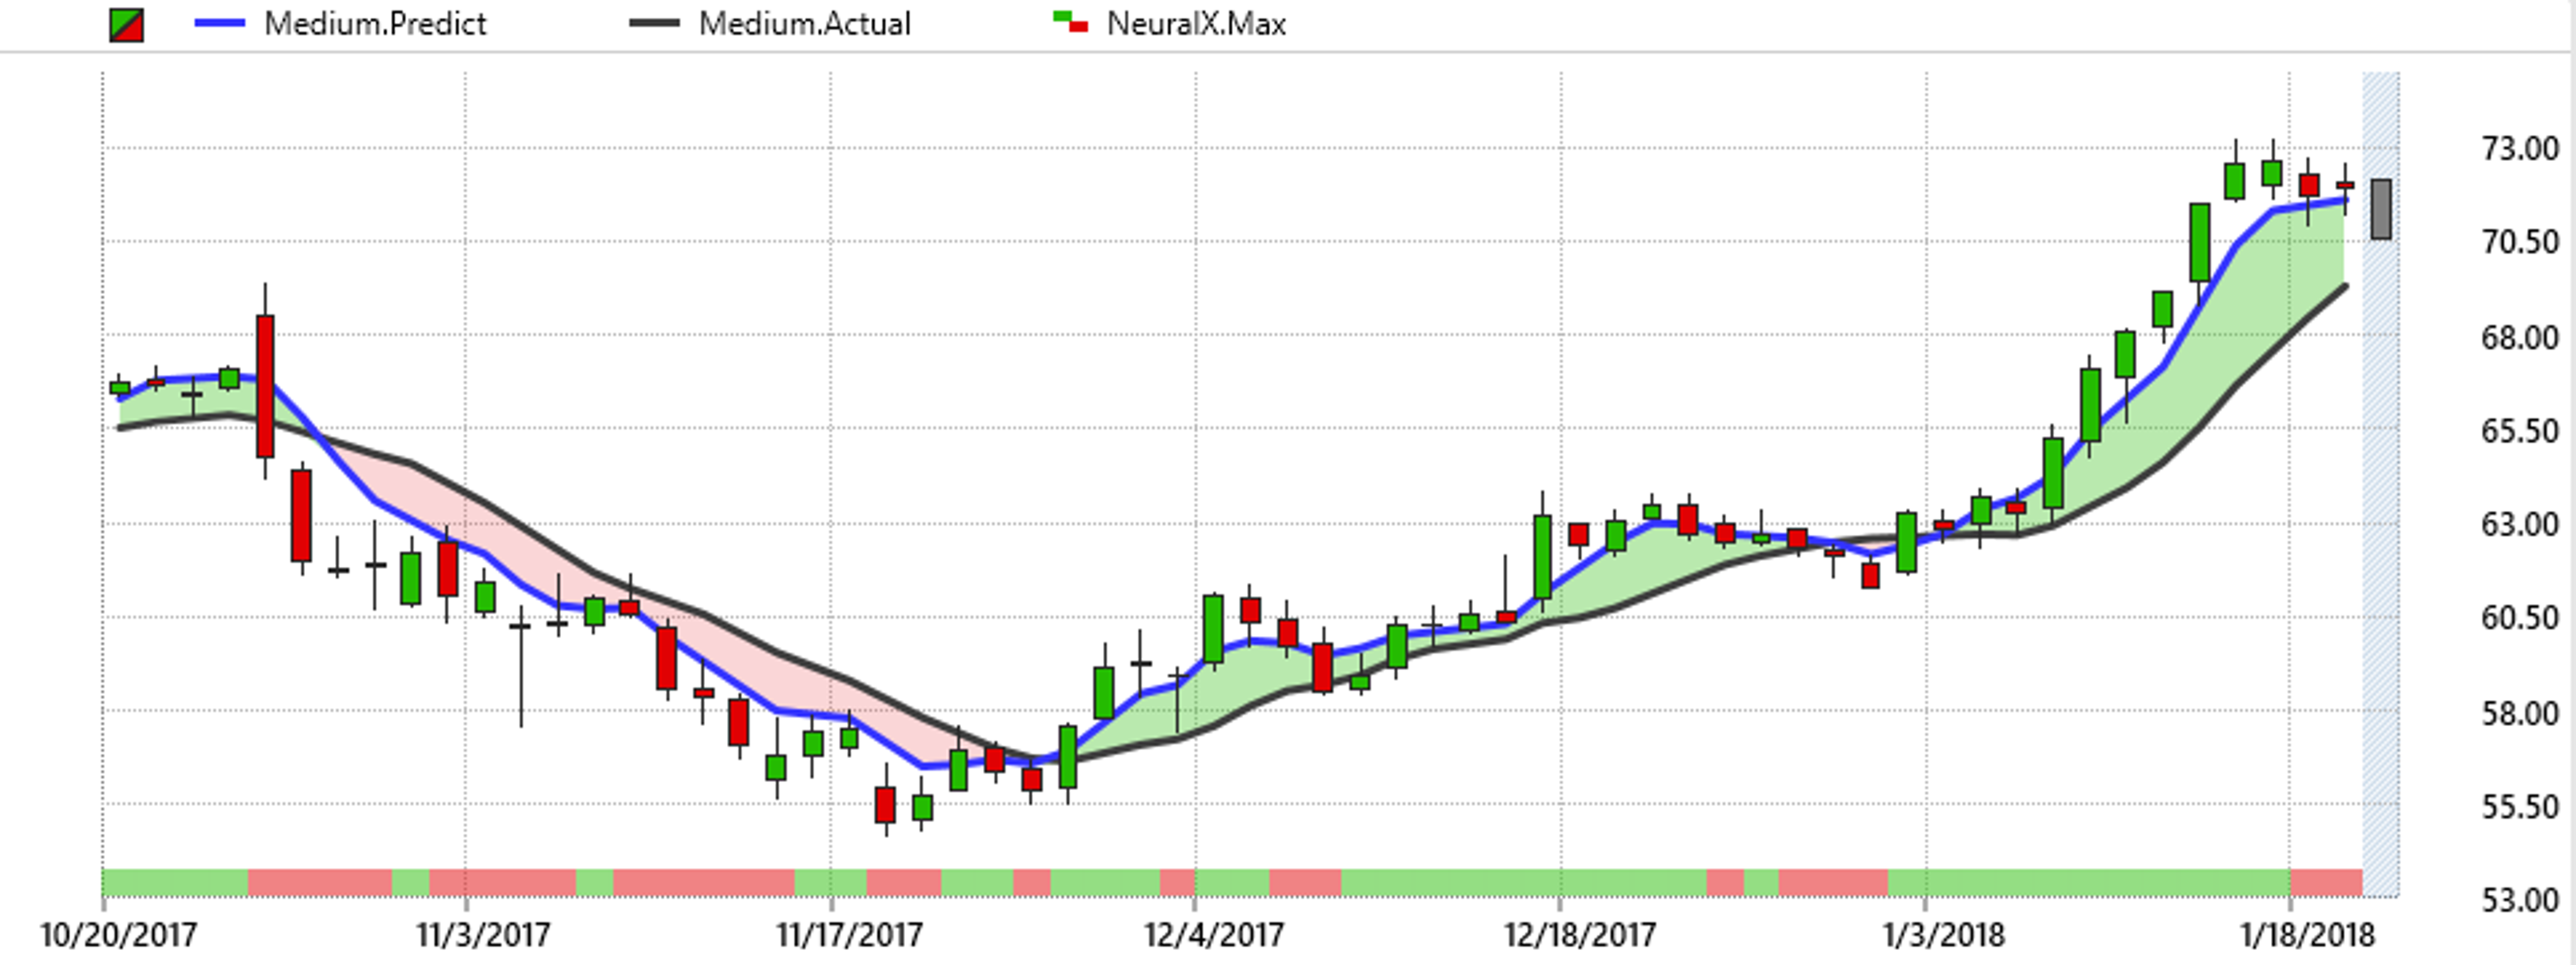
Cardinal Health also had a crossover to the upside at the start of the year. You can see how it's actually been in a mostly bullish trend since mid-November, save for a brief spell at the end of 2017. Since the most recent crossover at the start of the year the stock is up about 20 percent, and it shows no signs of slowing down.
Fluor Corporation FLR

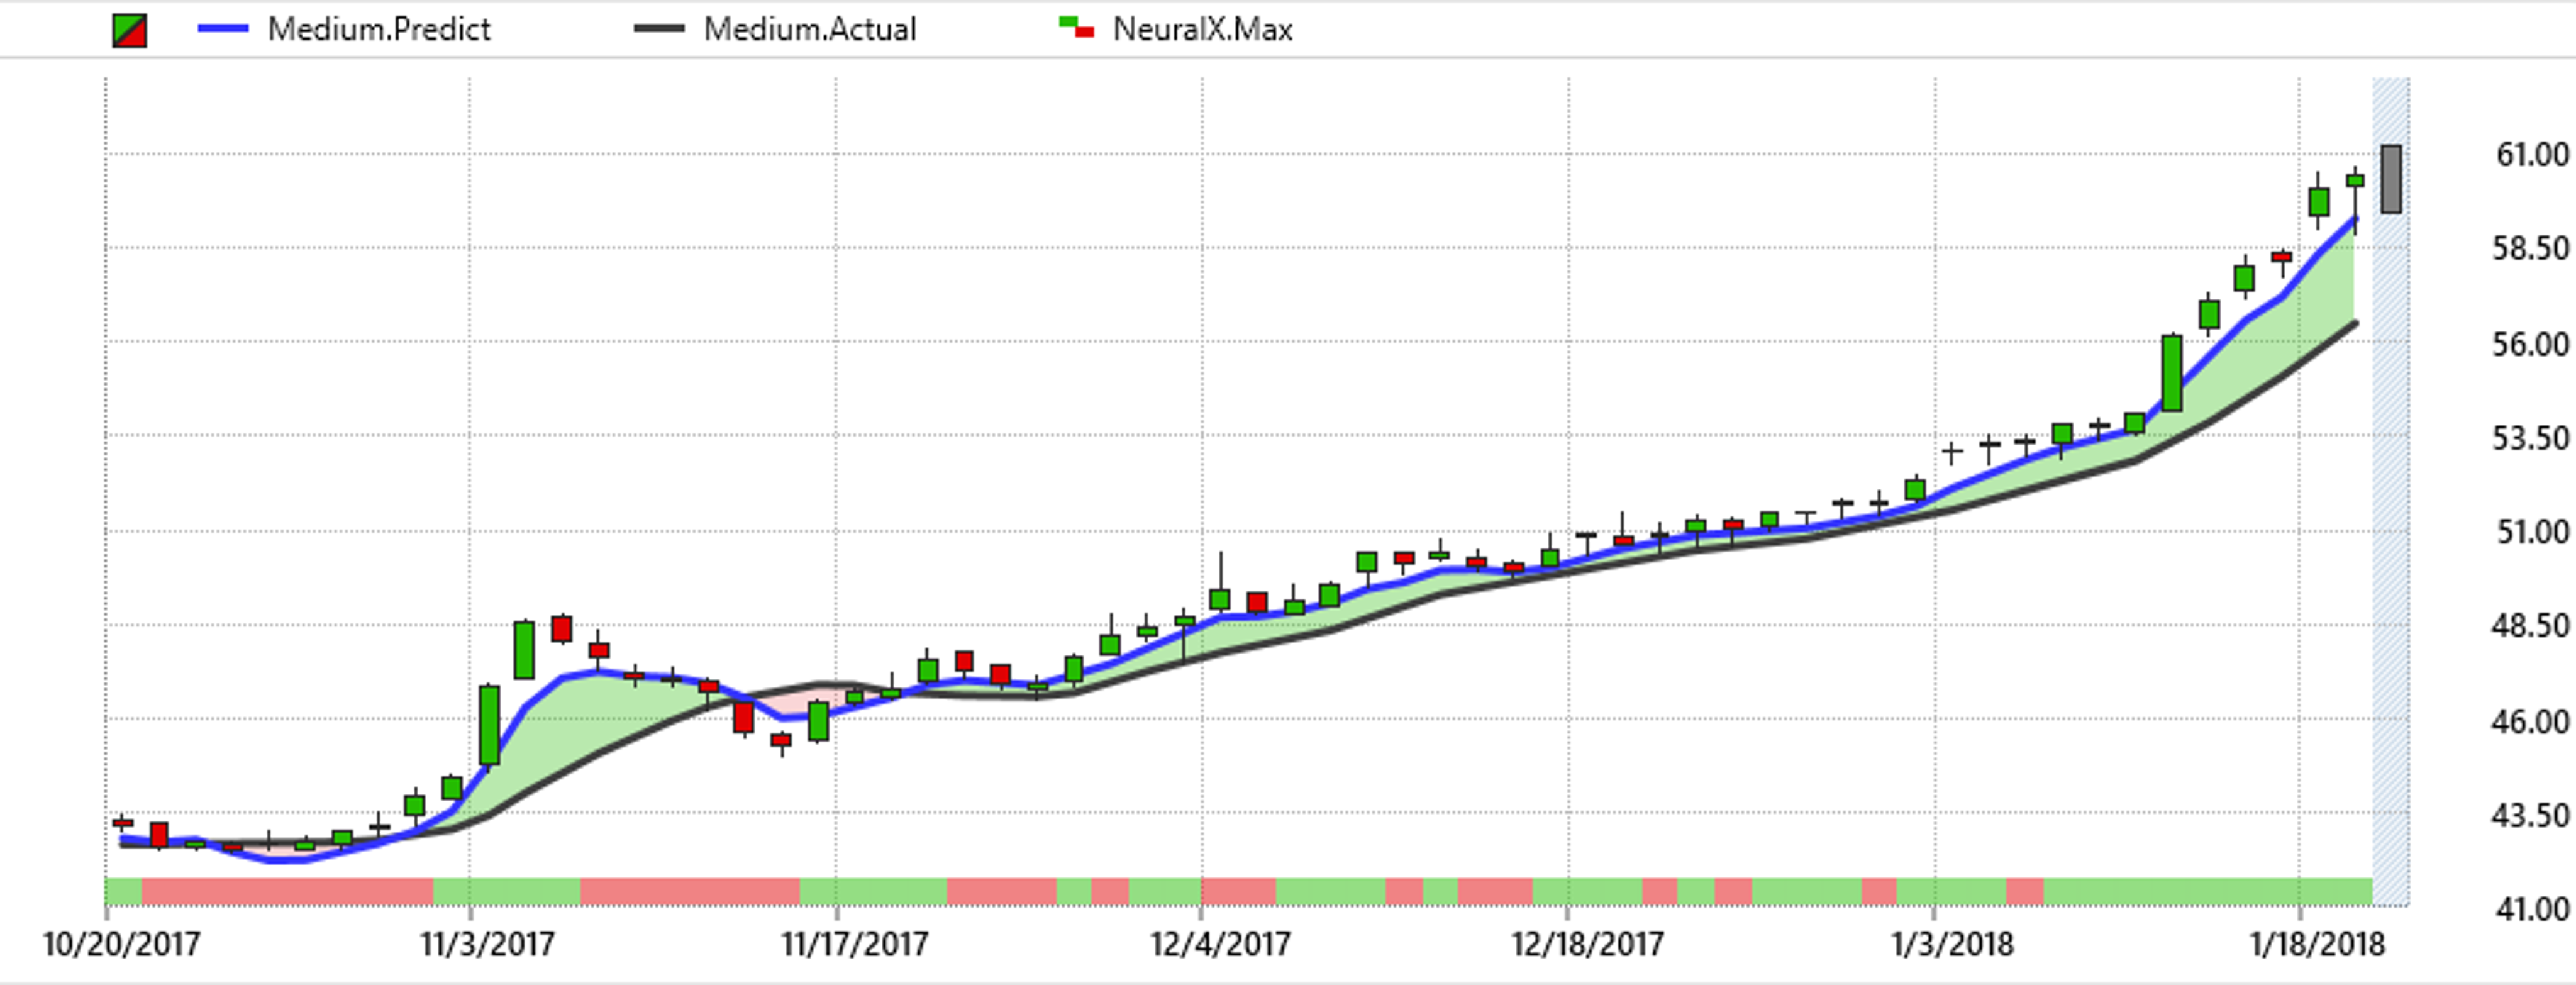
Fluor has been on a slow and steady run since its bullish trend took shape on November 19. The trend has only gotten stronger in the last week, undoubtedly because the company was awarded a contract for Shell. The contract led to an upgrade by Credit Suisse, who sees the company being boosted by energy sector spending. In 2018 the stock is up about 18 percent and is currently making new 52-week highs.
Duke Energy Corp DUK

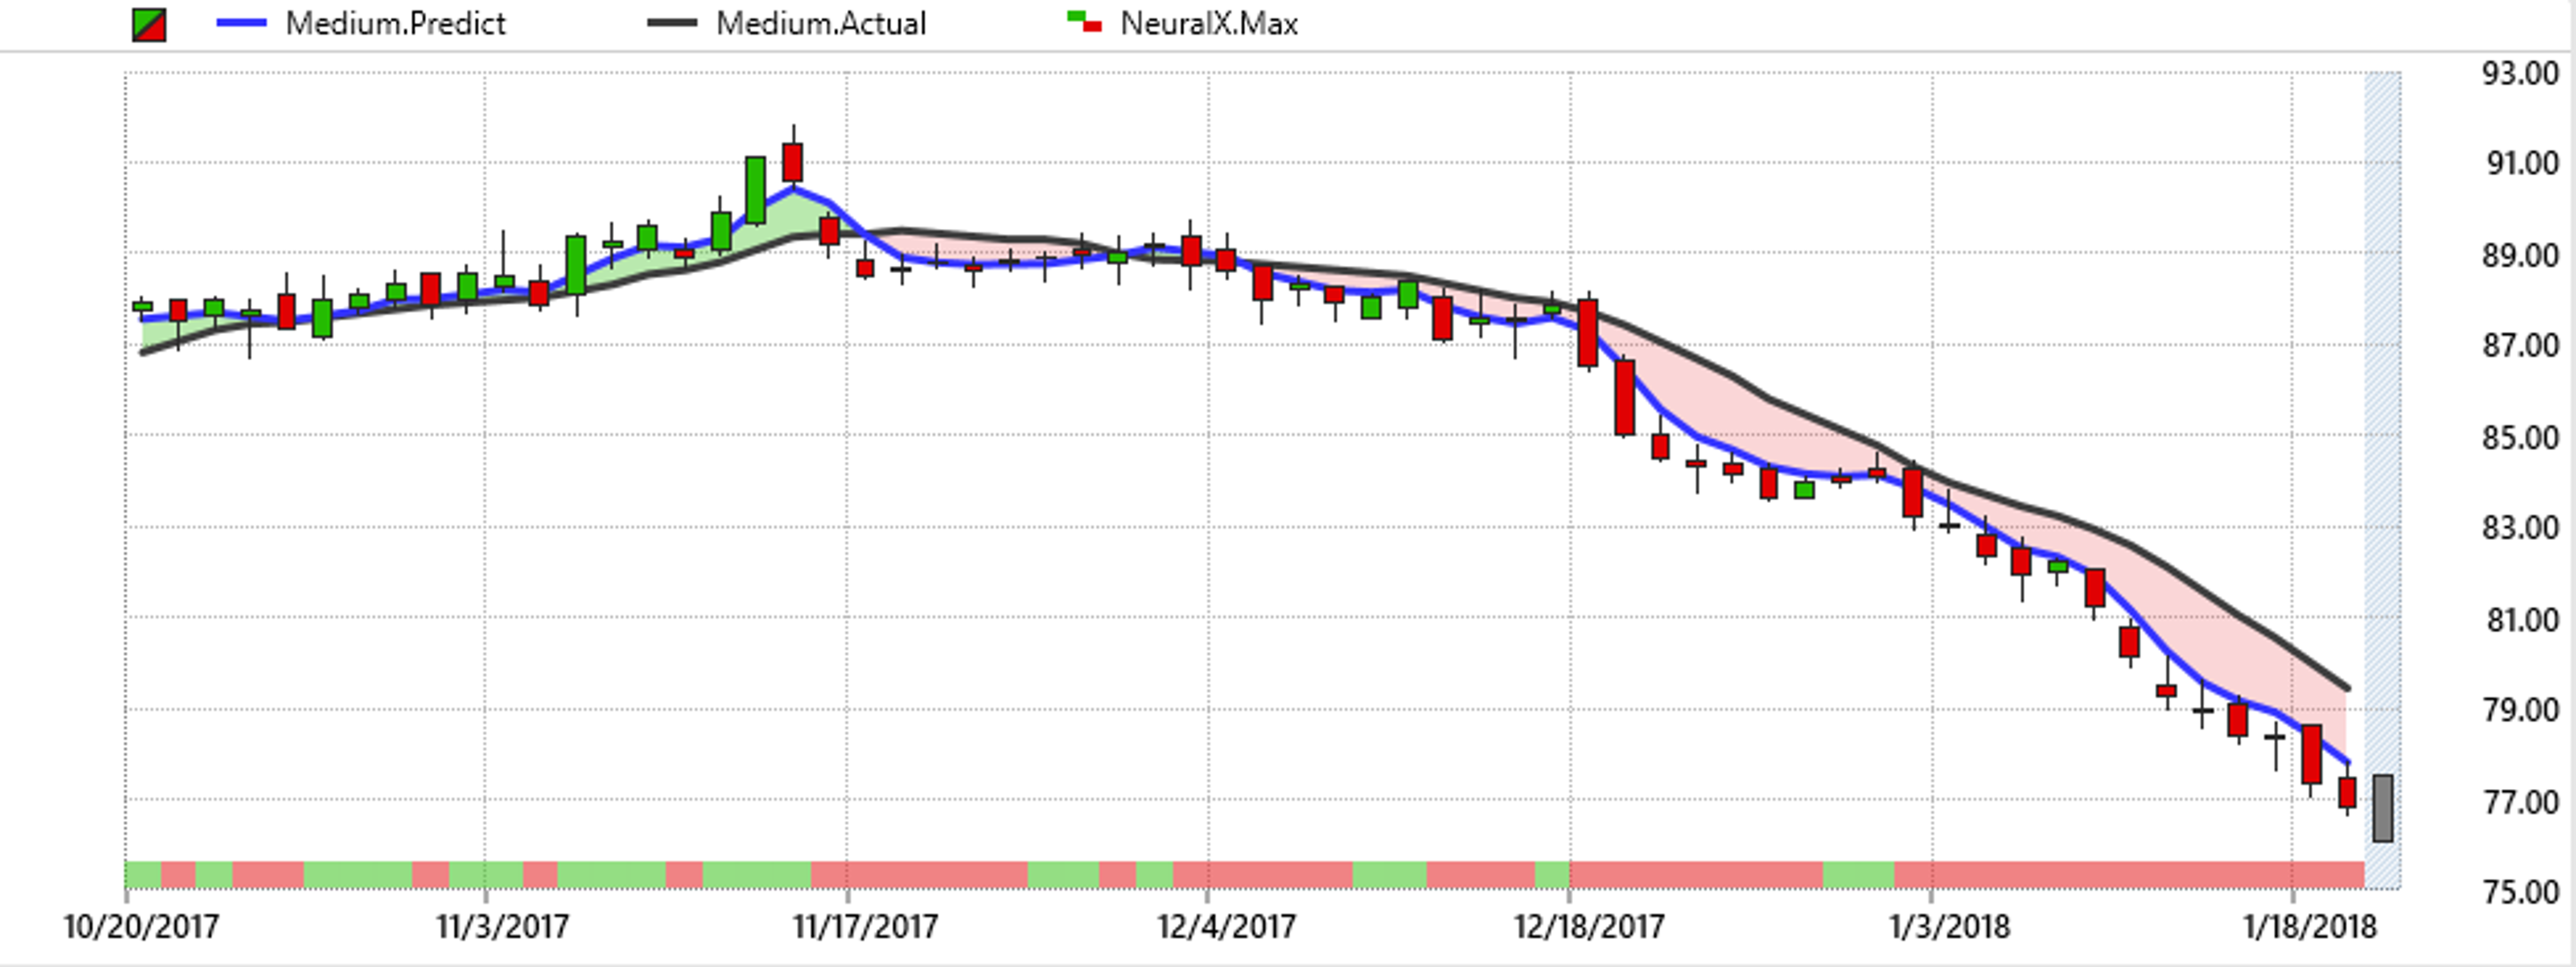
Duke Energy's chart looks a little different. You can see how on November 18 the trend turned bearish and has largely stayed that way in the succeeding eight weeks. At that point the stock had reached a new all-time high, but the crossover of the black simple 10-day moving average line over the predicted moving average line indicated the trend had reversed. Since that trend reversal, the stock is down over 15 percent and it shows no sign of slowing down.
American Electric Power Company Inc AEP

American Electric Power also had a crossover to the downside, this one occurring in early December. Like Duke Energy, this stock had also been at all-time highs when the trend reversed. Right now the trend appears to be intact, though the gap between the two moving averages seems to be closing slightly. In 2018 the stock is down about 6 percent.
Watch the full Hot Stocks Outlook below
About the Hot Stocks Outlook
The Hot Stocks Outlook is a weekly series. It’s designed to show traders how improving their timing is the key to maximizing gains and minimizing losses. VantagePoint Trading Software identifies trend reversals with up to 86 percent accuracy, helping traders get into the right side of trades at just the right time.
VantagePoint is an editorial partner of Benzinga.
© 2024 Benzinga.com. Benzinga does not provide investment advice. All rights reserved.
Trade confidently with insights and alerts from analyst ratings, free reports and breaking news that affects the stocks you care about.

