


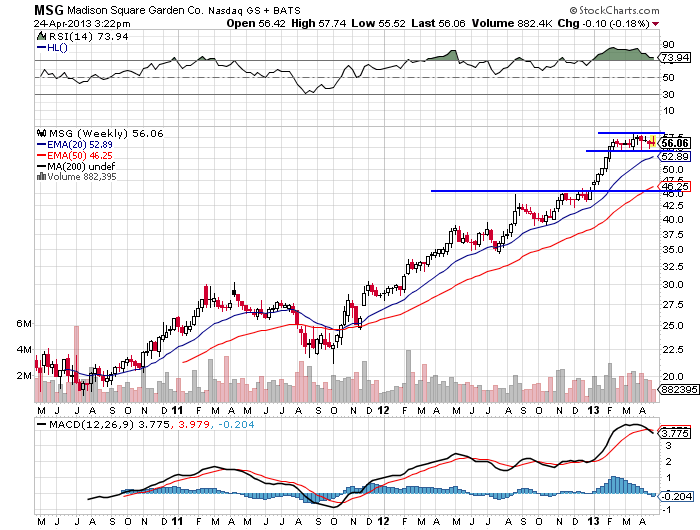
Madison Square Garden MSG has been on a solid up-trend since its debut in 2010. For the past 3 months MSG has been stuck in a price channel between $55 and $58 despite market strength. On the weekly chart we see that prices have been in heavily overbought conditions based on the RSI, and the MACD has formed a bearish crossover from its large run-up. This could be seen as consolidation, but one should let market prices dictate the next move whether that be up or down. A breakdown under $55 could bring a pull-back in prices down to the 50 EMA at $46.25 slightly above past resistance at $45 and still be in an up-trend. A breakout above $58 would be a sign the consolidation is over and prices are set to make new highs.
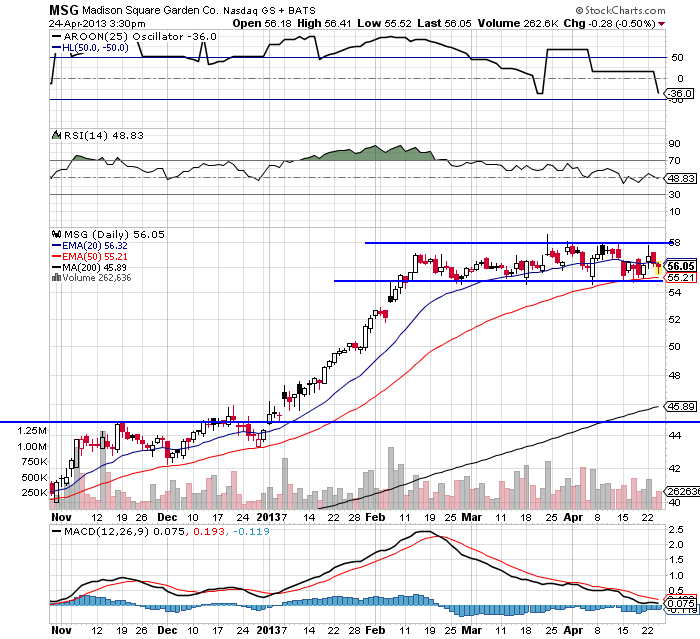
What to do; Based on the daily chart below, a trader can profit from a movement in price in two ways.
1. Prices close below $55 signaling a breakdown, which is also in confluence with a breakdown below the 50 EMA support currently at $55.21. Traders can SELL SHORT with a buy stop just above the top of the channel at $58 with a target price of $46 just above the 200 SMA support.
2. Prices close above $58 signaling a breakout of recent consolidation and a continuation of the up-trend. Traders can BUY on a close above $58 with a stop loss just below the bottom of the channel at $55. A trailing stop-loss could then be utilized since no resistance exists above the $58 all-time highs.
© 2024 Benzinga.com. Benzinga does not provide investment advice. All rights reserved.
Trade confidently with insights and alerts from analyst ratings, free reports and breaking news that affects the stocks you care about.

