


The Health Care sector as a more defensive sector overall remains a positive holding in 2012 despite volatility in overall markets. Nevertheless, uncertainties surrounding government health care changes and mandates remain a drag as do patent expirations is some key drugs. There is a lot to choose from in terms of indexes linked to ETFs. Some indexes are passive and duplicative relatively while some are “enhanced” making them quasi-active. The latter apply quantitative analytical techniques and skills to provide outperformance. Investors should note that in a rising market particularly ETFs linked to enhanced issues will tend to outperform conventional index linked issues. I’ve not done enough analysis to determine their relative performance during down market periods.
New ETFs from highly regarded and substantial new providers are also being issued. These may include Charles Schwab’s ETFs and Scottrade’s Focus Shares which both are issuing new ETFs with low expense ratios and commission free trading at their respective firms. These may also become popular as they become seasoned.
There is currently an expanding list of 24 ETFs oriented to the healthcare sector with more on the way. The following analysis features a fair representation of ETFs available. We believe from these investors may choose an appropriate ETF to satisfy the best index-based offerings individuals and financial advisors may utilize.
ETFs are based on indexes tied to well-known index providers including Russell, S&P, Barclays, MSCI, Dow Jones and so forth. Also included are some so-called “enhanced” indexes that attempt to achieve better performance through more active management of the index.
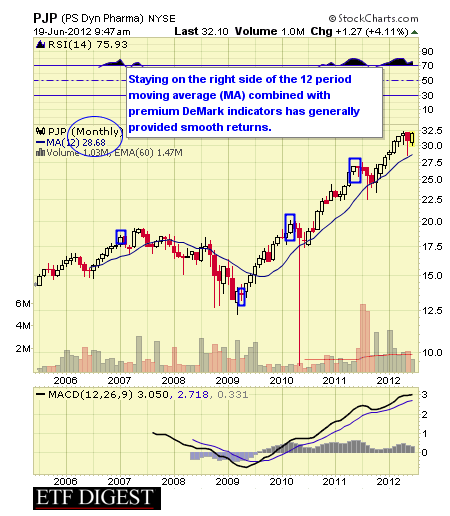
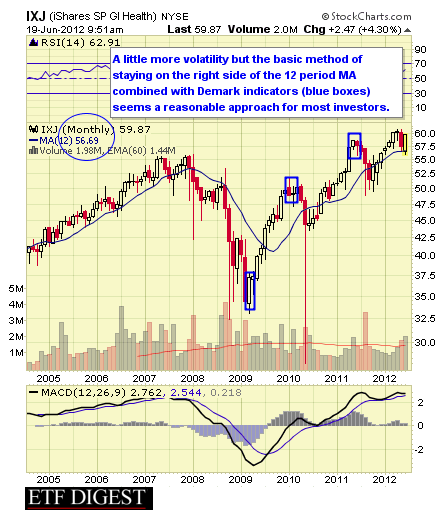
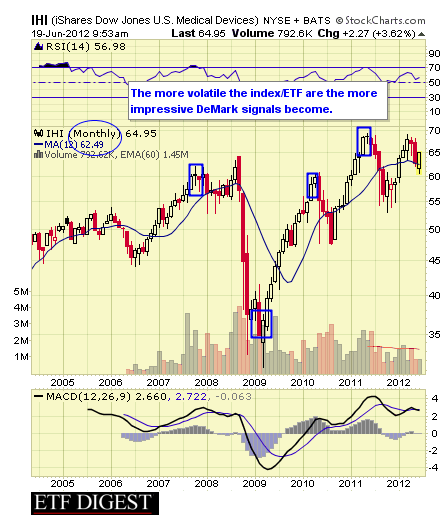
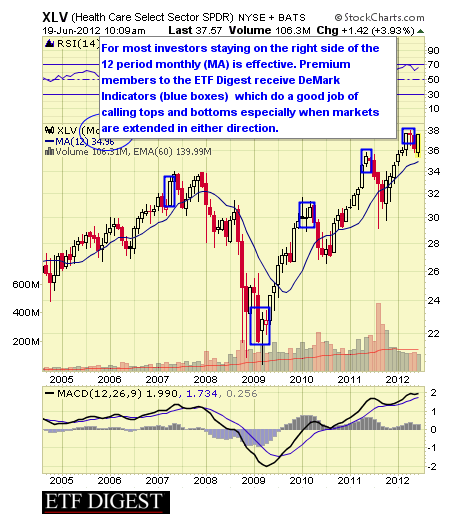
We feature a technical view of conditions from monthly chart views. Simplistically, we recommend longer-term investors stay on the right side of the 12 month simple moving average. When prices are above the moving average, stay long, and when below remain in cash or short. Some more interested in a fundamental approach may not care so much about technical issues preferring instead to buy when prices are perceived as low and sell for other reasons when high; but, this is not our approach. Premium members to the ETF Digest receive added signals when markets become extended such as DeMark triggers to exit overbought/oversold conditions.
For traders and investors wishing to hedge, leveraged and inverse issues are available to utilize from ProShares and Direxion and where available these are noted.
#10: PowerShares Dynamic Pharmaceuticals ETF PJP


PJP follows the Dynamic Pharmaceuticals Intellidex Index which is designed to provide capital appreciation by thoroughly evaluating companies based on a variety of investment merit criteria, including fundamental growth, stock valuation, investment timeliness and risk factors. The fund was launched in June 2005. The expense ratio is 0.60%. AUM equal $256M and average daily trading volume is 77K shares.
As of June 2012 the annual dividend yield was 0.62% and YTD return 12.55%. The one year return was 23.16% demonstrating the higher volatility with enhanced indexes.
Data as of June 2012
PJP Top Ten Holdings
-
Gilead Sciences Inc (GILD): 5.47%
-
Abbott Laboratories (ABT): 5.21%
-
Pfizer Inc (PFE): 5.15%
-
Eli Lilly and Company (LLY): 5.04%
-
Amgen Inc (AMGN): 4.99%
-
Merck & Co Inc (MRK): 4.89%
-
Bristol-Myers Squibb Company (BMY): 4.87%
-
Johnson & Johnson (JNJ): 4.80%
-
Warner Chilcott PLC Class A (WCRX): 3.46%
-
Watson Pharmaceuticals Inc. (WPI): 3.36%
#9: iShares S&P Global Health Care ETF IXJ
IXJ follows the S&P Global Health Care Index including a wide range of companies from biotech, manufacturing, medical devices and pharmaceuticals. The fund was launched in November 2001. The expense ratio is 0.48%.
AUM equal $538M with average daily trading volume around 86K shares As of June 2012 the annual dividend yield was yield 2.07% with YTD performance 5.15%. The one year return was 5.00%.
Data as of June 2012
IXJ Top Ten Holdings
-
Johnson & Johnson (JNJ): 7.64%
-
Pfizer Inc (PFE): 7.35%
-
Novartis AG (NVSEF): 6.35%
-
Merck & Co Inc (MRK): 5.10%
-
GlaxoSmithKline PLC (GLAXF): 4.98%
-
Roche Holding AG (RHHVF): 4.89%
-
Abbott Laboratories (ABT): 4.33%
-
Sanofi (SAN): 3.51%
-
UnitedHealth Group Inc (UNH): 2.59%
-
Novo Nordisk A/S (NONOF): 2.51%
#8: iShares Dow Jones U.S. Medical Devices Index ETF IHI
IHI follows the Dow Jones U.S. Select Medical Equipment Index which measures the entire spectrum of equipment in the U.S. equity market. The fund was launched in May 2006. The expense ratio is 0.48%. AUM equal $301M with average daily trading volume around 52K shares. As of June 2012 the annual dividend yield was 0.24% with YTD performance 9.41%.
The one year return was -0.80%. The two distinguishing YTD performance versus the one year return reflects more volatility in the index.
Data as of June 2012
IHI Top Ten Holdings
-
Medtronic, Inc. (MDT): 10.90%
-
Covidien PLC (COV): 8.64%
-
Intuitive Surgical, Inc. (ISRG): 7.67%
-
Thermo Fisher Scientific Inc (TMO): 7.06%
-
Stryker Corporation (SYK): 6.29%
-
St Jude Medical, Inc. (STJ): 5.45%
-
Zimmer Holdings Inc (ZMH): 5.20%
-
Boston Scientific, Inc. (BSX): 4.44%
-
Waters Corporation (WAT): 3.86%
-
Varian Medical Systems, Inc. (VAR): 3.65%
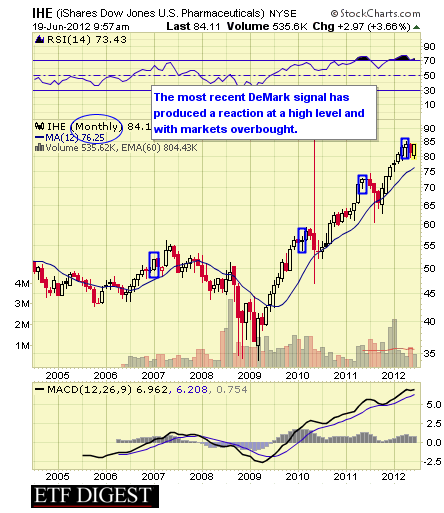
#7: iShares Dow Jones U.S. Pharmaceutical ETF IHE
IHE follows the Dow Jones U.S. Select Pharmaceutical Index which measures the performance of this sector of the U.S. equity market. The fund was launched in May 2006. The expense ratio is 0.48%. AUM equal $384 and average daily trading volume is 30K shares. As of June 2012 the annual dividend yield is 0.84% and YTD return 9.13%.
The one year return was 19.18% once again indicating higher volatility within this sector and a flight to a more defensive sector during 2011 chaotic market conditions.
Data as of June 2012
IHE Top Ten Holdings
-
Pfizer Inc (PFE): 9.28%
-
Johnson & Johnson (JNJ): 9.04%
-
Merck & Co Inc (MRK): 7.92%
-
Abbott Laboratories (ABT): 7.64%
-
Bristol-Myers Squibb Company (BMY): 6.04%
-
Eli Lilly and Company (LLY): 5.34%
-
Allergan, Inc. (AGN): 4.41%
-
Watson Pharmaceuticals Inc. (WPI): 3.48%
-
Forest Laboratories, Inc. (FRX): 3.17%
-
Mylan Inc (MYL): 3.07%
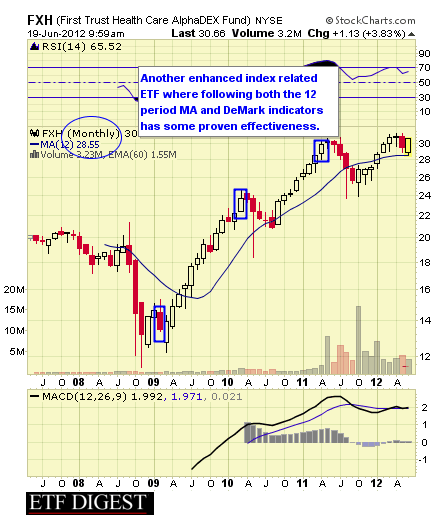
#6: First Trust Health Care AlphaDEX ETF FXH
FXH follows the StrataQuant Health Care index which is an "enhanced" index developed, maintained and sponsored by the NYSE Euronext or its affiliates which employs the AlphaDEX stock selection methodology to select health care stocks from the Russell 1000 Index. The fund was launched in May 2007. The expense ratio is 0.70%.
AUM equal $543M and average daily trading volume is 181K shares. As of June 2012 the annual dividend yield was 0.11% and YTD return 11.14%. The one year return was 3.71%.
Data as of June 2012
FXH Top Ten Holdings
-
Catalyst Health Solutions, Inc. (CHSI): 3.20%
-
SXC Health Solutions Corporation (SXCI): 2.85%
-
Community Health Systems Inc (CYH): 2.58%
-
Intuitive Surgical, Inc. (ISRG): 2.52%
-
Boston Scientific, Inc. (BSX): 2.47%
-
Eli Lilly and Company (LLY): 2.43%
-
Forest Laboratories, Inc. (FRX): 2.37%
-
LifePoint Hospitals, Inc. (LPNT): 2.34%
-
Alexion Pharmaceuticals, Inc. (ALXN): 2.30%
-
Regeneron Pharmaceuticals, Inc. (REGN): 2.19%
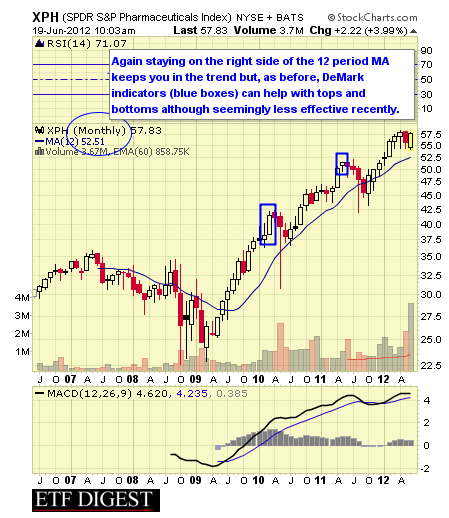
#5. SPDR S&P Pharmaceuticals ETF XPH
XPH follows the S&P Pharmaceuticals Select Industry Index which measures the pharmaceuticals sub-industry portion of the S&P Total Markets Index. The S&P TMI tracks all the U.S. common stocks listed on the NYSE, AMEX, NASDAQ National Market and NASDAQ Small Cap exchanges. The Pharmaceuticals Index is an equal weighted market cap index. The fund was launched in June 2006.
AUM equal $441M and average daily trading volume is 112K shares. As of June 2012 the annual dividend yield was 0.86% and YTD return 11.18%. The one year return was 17.13%.
Data as of June 2012
XPH Top Ten Holdings
-
Vivus (VVUS): 4.95%
-
Watson Pharmaceuticals Inc. (WPI): 4.93%
-
Questcor Pharmaceuticals, Inc. (QCOR): 4.77%
-
Warner Chilcott PLC Class A (WCRX): 4.67%
-
Abbott Laboratories (ABT): 4.40%
-
Salix Pharmaceuticals, Ltd. (SLXP): 4.34%
-
Forest Laboratories, Inc. (FRX): 4.32%
-
Eli Lilly and Company (LLY): 4.27%
-
Pfizer Inc (PFE): 4.20%
-
Bristol-Myers Squibb Company (BMY): 4.18%
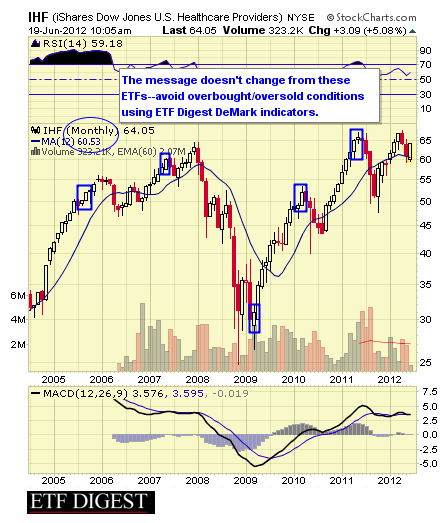
#4: iShares DJ U.S. Health Care Providers ETF IHF

IHF tracks the Dow Jones U.S. Select Healthcare U.S. equity market. As such the index contains fewer holdings. The fund was launched in May 2006. The expense ratio is 0.48%. AUM equal $226M with average daily trading volume over 76K shares.
As of June 2012 the annual dividend yield was yield 0.12% with YTD performance 7.48%. The one year return was -0.45%.
Data as of June 2012
IHF Top Ten Holdings
-
UnitedHealth Group Inc (UNH): 13.73%
-
Express Scripts (ESRX): 13.33%
-
WellPoint Inc (WLP): 7.64%
-
Aetna Inc (AET): 5.28%
-
Cigna Corp (CI): 4.86%
-
Humana (HUM): 4.66%
-
Quest Diagnostics Inc (DGX): 3.84%
-
Laboratory Corporation of America Holdings (LH): 3.58%
-
DaVita Inc (DVA): 3.36%
-
HCA Holdings Inc (HCA): 2.38%
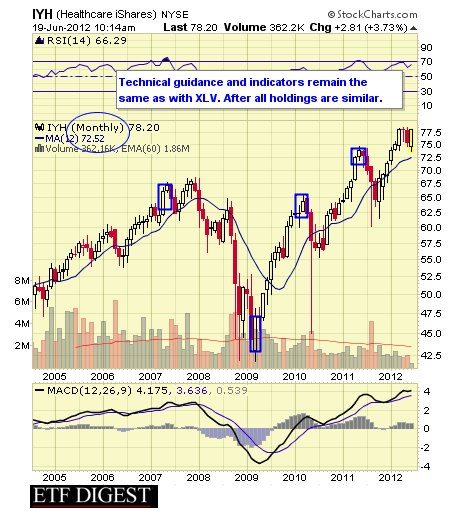
#3: iShares Dow Jones U.S. Health Care ETF IYH
IYH follows the Dow Jones U.S. Health Care Index which includes most constituents from the health care sector. The fund was launched in June 2006. The expense ratio is 0.48%. AUM equal $604M while average daily trading volume is just fewer than 44K shares.
As of June 2012 the annual dividend yield was yield 1.14% with YTD performance 8.36%. The one year return was 8.71%
Data as of June 2012
IYH Top Ten Holdings
-
Johnson & Johnson (JNJ): 11.19%
-
Pfizer Inc (PFE): 11.02%
-
Merck & Co Inc (MRK): 7.57%
-
Abbott Laboratories (ABT): 6.30%
-
Amgen Inc (AMGN): 3.99%
-
UnitedHealth Group Inc (UNH): 3.93%
-
Bristol-Myers Squibb Company (BMY): 3.75%
-
Express Scripts (ESRX): 2.74%
-
Eli Lilly and Company (LLY): 2.64%
-
Medtronic, Inc. (MDT): 2.56%
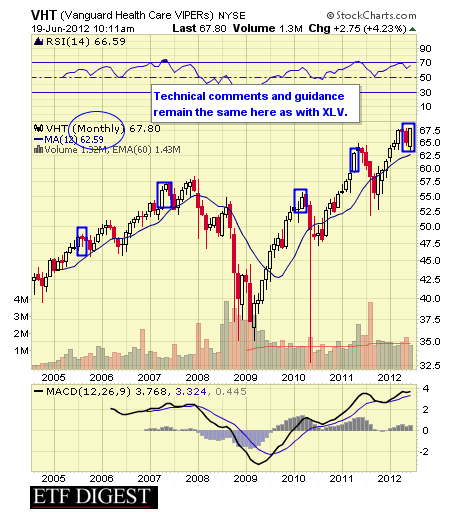
#2: Vanguard Health Care ETF (VHT)
VHT follows the MSCI US Investable Market Health Care 25/50 Index and is another broad index covering the entire spectrum of the health care industry. The fund was launched in January 2004. The expense ratio is 0.19%. AUM equal $811M and average daily trading volume is a low 79K shares. The lower volume indicates Vanguard’s financial advisor audience with more of a buy and hold philosophy.
As of June 2012 the annual dividend yield was 1.58% with YTD performance 9.36%. The one year return was 9.02%. VHT trades commission free at Vanguard.
Data as of June 2012
VHT Top Ten Holdings
-
Pfizer Inc (PFE): 9.86%
-
Merck & Co Inc (MRK): 6.63%
-
Abbott Laboratories (ABT): 5.41%
-
UnitedHealth Group Inc (UNH): 3.56%
-
Bristol-Myers Squibb Company (BMY): 3.24%
-
Amgen Inc (AMGN): 3.06%
-
Eli Lilly and Company (LLY): 2.38%
-
Medtronic, Inc. (MDT): 2.34%
-
Gilead Sciences Inc (GILD): 2.08%
#1: SPDR Healthcare Select Sector ETF (XLV)
XLV follows the Health Care Select Sector Index. The fund was launched in December 1998. The expense ratio is 0.18%. Assets under Management (AUM) equal $4B and average daily trading volume is over 6M shares. As of June 2012 the annual dividend yield was yield 1.44% with YTD performance 6.83%. The one year return was 8.00%.
Data as of June 2012
XLV Top Ten Holdings
-
Johnson & Johnson (JNJ): 12.27%
-
Pfizer Inc (PFE): 11.80%
-
Merck & Co Inc (MRK): 8.19%
-
Abbott Laboratories (ABT): 5.89%
-
UnitedHealth Group Inc (UNH): 4.21%
-
Bristol-Myers Squibb Company (BMY): 4.05%
-
Amgen Inc (AMGN): 3.94%
-
Express Scripts (ESRX): 3.14%
-
Eli Lilly and Company (LLY): 2.99%
-
Medtronic, Inc. (MDT): 2.76%
We rank the top 10 ETF by our proprietary stars system as outlined below. However, given that we’re sorting these by both short and intermediate issues we have split the rankings as we move from one classification to another.
Strong established linked index
Excellent consistent performance and index tracking
Low fee structure
Strong portfolio suitability
Excellent liquidity

Established linked index even if “enhanced”
Good performance or more volatile if “enhanced” index
Average to higher fee structure
Good portfolio suitability or more active management if “enhanced” index
Decent liquidity


Enhanced or seasoned index
Less consistent performance and more volatile
Fees higher than average
Portfolio suitability would need more active trading
Average to below average liquidity


Index is new
Issue is new and needs seasoning
Fees are high
Portfolio suitability also needs seasoning
Liquidity below average


It’s essential to remember it’s really a game of battleship for sponsors seeking to be first to a sector space or just being competitive in the space. This is their business interest apart from your investment interest. You should always ignore their interests and align your choices with what serves your objectives best.
For further information about portfolio structures using technical indicators like DeMark and other indicators, take a free 14-day trial at ETF Digest. Follow us on Twitter and Facebook as well and join our group conversations.
You may address any feedback to: feedback@etfdigest.com
The ETF Digest has no current positions in the featured securities.
(Source for data is from ETF sponsors and various ETF data providers.)
© 2024 Benzinga.com. Benzinga does not provide investment advice. All rights reserved.
Trade confidently with insights and alerts from analyst ratings, free reports and breaking news that affects the stocks you care about.

