PAGE 01 COVER

Guidebook

The Only Trading Dashboard You’ll Ever Need

2026

1
PAGE 02 INTRODUCTION

Introduction

Since 2011, Benzinga has been trying to
raise the tide for the retail investor

Benzinga Pro is our flagship newswire platform with real-time market news and research designed for active traders and investors. 

It offers a powerful suite of tools, including live audio squawk, breaking news headlines, real-time alerts, advanced stock screeners, and detailed financial data. 

With its intuitive interface and customizable features, Benzinga Pro helps users stay ahead of market-moving events, spot trading opportunities, and make informed decisions quickly.

Whether you’re a day trader, swing trader, or long-term investor, Benzinga Pro provides the actionable insights needed to navigate the markets with confidence.

This guide intends to provide an overview of how to use the different tools in Benzinga Pro, as well as inspire the end user to create their own custom workspace!

2
PAGE 03 ACCESSING BENZINGA PRO

Accessing Benzinga Pro

Benzinga Pro is web-based, so there
is no application to download.

YOU CAN LOG IN BY NAVIGATING TO

You will need a username and password to log in.
If you have created a Benzinga account already, these
are the credentials you need to enter.

Logging In

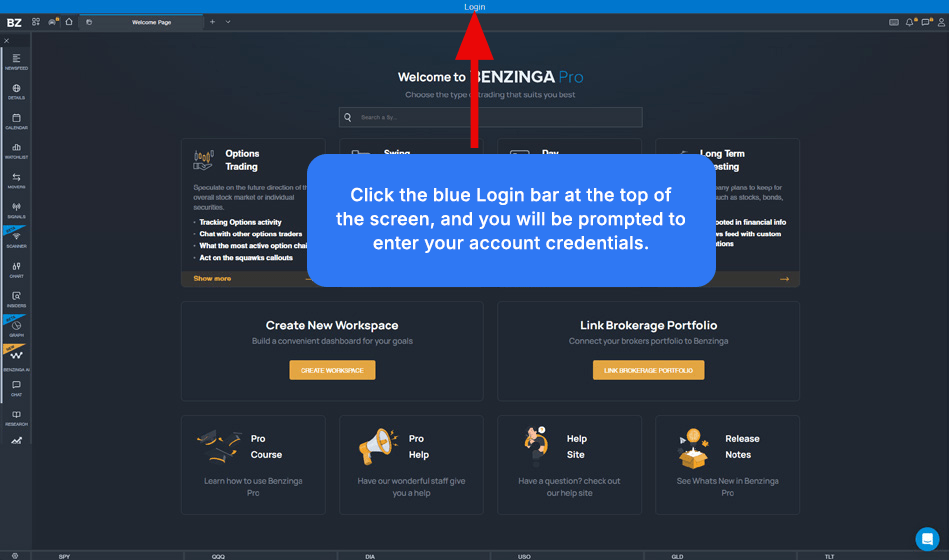
Once you navigate to pro.benzinga.com,
you should see a window that looks like this:

Accessing Benzinga Pro3
PAGE 04 NAVIGATING WITHIN BENZINGA PRO

Navigating within Benzinga Pro

Once you have logged in, you should see
the Benzinga Pro Welcome Page

This page has lots of helpful content for
beginners, including a video-based guide
for how to use the platform.

There are several icons in the upper-left
corner and upper right corner of this
welcome page:

The BZ Logo allows you to hide or display the side menu,
which contains buttons to the different tools in Pro.

4
PAGE 05 PAGE 5

App Drawer Icon

Allows you to add any tools from the menu to the current

NOTE: If you add a tool while on the Welcome Page, it will create a new workspace with that tool added.

Squawk Icon

Gives you access to the squawk channels no matter what
workspace you have in focus.

The Squawk tool is on or off, and will not be added as a tool
to the workspace.

Home Icon

Takes you back to the Home workspace, which contains Gainers, Losers, three stocks that are moving today on a specific news catalyst, the Watchlist tool, and a pre-programmed “Top News” feed.

Next, you will see a
Welcome Page tab at the top.

This is the welcome screen you are shown when trying to log in.

Page 55
PAGE 06 PAGE 6

Next, you will see a + icon

Which allows you to create a new workspace.

Any new workspaces you add will be tabbed across the top of the page, in line with the Welcome Page.

You have no limit to how many workspaces you can build, and should you create more than can be displayed at one time, you will be able to scroll the tabbed workspaces by either:

1. Hovering your mouse at the left or right end of the tabs section.

2. Using your mouse wheel to scroll the workspace tabs.

You may also see a Downward Chevron icon

That will list all your workspaces in a dropdown menu similar
to the app drawer.

On the right-hand side, there are four more icons.

The first is a keyboard icon

That will open a hotkey reference.

These hotkeys are hard-coded and cannot be customized.

The bell icon

Is a shortcut to the Notification Center

This pane stores and filters all your alerts.

Page 66
PAGE 07 PAGE 7

The chat icon

Opens the chat window.

This gives you access to different rooms that are included in your Benzinga Pro subscription.
Mousing over this icon allows you to
pop out the chat, or dock it to the left or right side.

The final icon is for the settings menu

And looks like a person

This opens a drop-down with several choices ranging from Account,
Settings, Morning Update, and more!

Each tool has an X

In the upper right corner, which will close that tool.

Any settings or adjustments made will be lost when the tool is closed.

Each tool also has a 3-dot button

That gives access to ‘Flight Mode’ - which collapses some
of the tool to save on screen real estate.

This menu also contains the linking function, which allows you to manually link one tool to another or a group of linked tools. There is a shortcut to tool-specific settings, tips, and the ability to pop that tool out on its own.

Page 77
PAGE 08 TICKERS APPEAR RED, GREEN, OR WHITE

Tickers appear red, green, or white through out the platform.

Red means that the stock is down from yesterday’s close
Green means it is up from yesterday’s close
White means it is unchanged

Mousing over the ticker produces a hover-over menu with some at-a-glance information, as well as the ability to quickly add a note.

8
PAGE 09 BUILDING A WORKSPACE

Building a new workspace

Click the + button

At the top of the screen along the workspace tabs to create a new workspace.

This screen has two basic options. You can either select a
‘Recommended Workspace’ or a preset workspace which has
a combination of tools in it, or you can build your own workspace
by selecting the individual tools.

Building your workspace is easy! Simply enter a name for
this workspace, then select the tools you wish to use within
this workspace.

The order in which you click these tools will determine the order in which
these tools are added to the workspace. Once you have selected the
proper tools, click the blue create workspace button at the bottom.

PRO TIP: If you need more than 1 instance of a specific tool, like
Newsfeed, you can add them to the workspace after you create it.
Start with Newsfeed checked, and then use the app drawer icon
to add a second newsfeed.

Building a workspace9
PAGE 10 LAYOUT

Layout

Your collection of workspaces makes up your Layout, and you are
not limited to how many different workspaces
you can have within a given layout.

The platform will automatically save changes to your browser’s
local storage when it detects changes made to a workspace or
Layout, but you are encouraged to save your layout manually.

To do this, click the menu in the upper right corner
and then select Layouts from the dropdown.

This screen has two sections: Saved and Recent.

Saved holds all of the manual saved layouts you have created.
Recent holds the most recent autosaved layouts.

When saving your first layout, find the line in the ‘Recent’ section that has
a blue ‘Current’ banner next to it. This banner denotes the layout you are
currently using. Click the corresponding ‘Save’ button. This will add a record in the ‘Saved’ section above.

If you wish to update a saved layout, first make sure you load the proper layout. Once you have made changes, click the ‘Update’ button that corresponds to that layout. This will prompt you to click “Are you sure” you want to overwrite the saved layout.

You can also delete and load both Saved and Recent layouts as needed.

Layout10
PAGE 11 TOOLS – SQUAWK

Tools - Squawk

This is not like a radio where you can expect to hear something at all times. You will only hear content when news is being read.

The Squawk tool is an all-or-nothing audio feed that reads breaking news as it takes place. There is no ability to filter this tool, you simply turn it on and hear news as it happens. The Squawk icon in the upper left corner gives access to the Squawk menu no matter what workspace you have open.

The blue play button turns the squawk on or off, the mute button mutes and unmutes it, and the volume sliders allows you to precisely control how loud the Squawk is.

The Up Chevron icon above the volume number allows you to prioritize multiple squawk channels if applicable. Multiple channels can be turned on at once.

Tools – Squawk11
PAGE 12 TOOLS – NEWSFEED

Tools - Newsfeed

The newsfeed is the heart and soul of Benzinga Pro.

It is real-time and customizable, and allows users to drill down to
exactly what they want to find. Users can also add more than 1 newsfeed
and configure them differently.

The search bar in the newsfeed is extremely powerful.
It allows the user to filter for:

Stocks

Keywords

Boolean expressions

Linking

Watchlists

Scanner configurations

Verticals (Ex: Airlines, Tech, AI, Drone)

As an example, an easy way
of getting just the big news
of the day is to filter a
newsfeed by ticker SPY:

Tools – Newsfeed12
PAGE 13 PAGE 13

Tools - Newsfeed

You can also control the different news sources that appear in each individual newsfeed, and you control what category of news appears in the feed.

To do this, click the Sources button in the top left corner of the newsfeed

Checking the different boxes turns those sources on, thus adding that news to the feed. Additionally, some ‘parent’ sources like Press Releases contain ‘child’ sources like the individual press release wires.

Clicking the box of the parent selects all of the subsequent
options, while clicking the text of the source allows you
to select individual options.

Furthermore, you can click the checkbox to OMIT this category from
the newsfeed. This is represented by a red box with an X in it rather than a white box with a check mark in it.

The color slider on the far right side allows you to color-code different
sources or categories (sub-group of Benzinga Wire source) of news so
they can be easily distinguished within a newsfeed.

Here is an example of a keyword expression built using the search bar:

Page 1313
PAGE 14 PAGE 14

Clicking the keyword gives the user the option of selecting the search mode

In this example, the expression is searching for any news results that contain the word Phase 1 in either the title or the body of the news post AND either approval or approved in the title only of the news post.

You can also filter the newsfeed by any available filter in the Scanner tool (such as Price, Market Cap, Float)by clicking the ‘Scanner’ button at the top of the newsfeed

Here is an example of filtering the newsfeed to only show news about stocks that are between 0 and 50 dollars, AND have a float of less than 30 million.

It’s worth noting that you can use the slider or custom value entry field by clicking on the corresponding button on the right, and you can also abbreviate larger numbers using K, M, B, or T.

PRO TIP: A post that displays a ticker and a +(number) next to it means that the news post applies to the ticker shown PLUS the other tickers listed when the user hovers over it.

PRO TIP: The right margin of each news post will identify which source this piece of news came from.

PRO TIP: You can jump to any date and time by using the Date button at the top of the newsfeed.

Page 1414
PAGE 15 TOOLS – DETAILS

Tools - Details

Details is the most informative tool within Benzinga Pro.
It often contains data and information from every other
tool that is specific to the stock in focus.

When you click on tickers from another tool, it will open a Details
tool with that ticker in focus if you don’t have a Details tool already.
If you already have a Details tool, it will simply put that ticker in focus.

The default tab is the Overview tab. This provides an at-a-glance
chart as well as other data and information about that stock.
The at-a-glance chart cannot have drawings or indicators added to it.
To do advanced charting, click on the Chart subtab (red arrow)
to bring up a Trading View chart.

You can change the ticker in focus by using the search bar at the top
(blue arrow). During the regular session, only the real-time price is displayed.
During the pre-market or the after-hours session, two prices are displayed.
The first price will be the real-time price of the current extended or pre-market session. The second price shows the most recent closing price.

Tools – Details15
PAGE 16 PAGE 16

The subtabs have all kinds of information filtered for
the specific stock. You should become familiar with
all of them. Scrolling down the overview tab shows more
content like “Bulls Say” and “Bears Say” as well as a company
description and a link to the company’s website.

You can also add price alerts, notes, or add that stock to a watchlist using the blue buttons in the upper right (green arrow).

Page 1616
PAGE 17 TOOLS – MARKET EVENTS

Tools - Market Events

The Market Events tool is not a traditional calendar.
It contains 15 different calendars with specific information.

These range from Earnings and Analyst Ratings to Squawk
transcriptions and Unusual Option Activity.

Each calendar has specific columns
and filters that can be applied.

It is laid out in a grid format and behaves
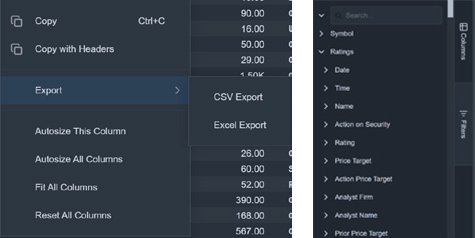
like a spreadsheet. Right-clicking gives a contextual menu that allows things like copying, auto sizing, and exporting to CSV or Excel format.

Tools – Market Events17
PAGE 18 TOOLS – WATCHLIST

Tools - Watchlist

The watchlist tool is used to create or edit watchlists.

These range from Earnings and Analyst Ratings to Squawk
transcriptions and Unusual Option Activity.

You can also link your brokerage portfolio and create a watchlist out of your active positions, stocks only.

This, and any other watchlist you create, can now be used as active filters elsewhere in the platform. This can very quickly help you drill down to stocks you care about.

You can also set up alerts for these watch lists

You can import watchlists stored as a file on your computer

You can cycle through your various watchlists using the drop-down

Each column can be sorted:

Red column header indicates sort from lowest to highest

Green column header indicates sort from highest to lowest

Blue column header indicates sort by absolute value highest to lowest

No color indicates no sort

You can remove tickers from this watchlist by right-clicking
the ticker or range of tickers.

Tools – Watchlist18
PAGE 19 TOOLS – MOVERS

Tools - Movers

Movers is a lightweight scanner designed to help you
find stocks that are moving very quickly.

Instead of full scanning capability, the user is offered several frequently used filters as well as session and period delineation. The Movers tool only updates once per minute with the most recent stock price. Movers only display the top 100 stocks based on % change from the filters you selected.

Movers is best paired with a Details tool, or simply select the preset “What’s Moving Scanner.” If you require faster refresh rates or more filters, please use the Scanner tool.

The selections made in the blue filter section of the tool will dictate the result shown in the lower portion.

You can break these stocks down by:

Gainers or losers

Premarket session, Regular session, or After Hours session

Period of the selected session

Sectors

You can also filter for Market Cap, Volume, Float, and
Price by using either the slider or entering a custom value.

Tools – Movers19
PAGE 20 TOOLS – SIGNALS

Tools - Signals

The signals tool is the output of our proprietary
algorithms that flag market transactions.

We call these signals. Signals are price or volume-related
events in stocks. New signals are added in real-time, triggering
any notifications that have been set.

Detailed information on each specific signal can be found in the
‘Help’ tab on the platform. Limited filters are available in the filters menu. Users can also use the different filtering methods via the
search bar. The notifications tab allows users to set notifications
for the signals selected. Signals can be saved as a config by clicking
the config area in the upper left.

Tools – Signals20
PAGE 21 TOOLS – CHART

Tools - Chart

This tool is the TradingView chart, found in the Chart tab of
Details, on its own. It has no additional functionality like Details
and allows the user to make the most of their screen real estate
by stripping away the header.

This tool is most effective when combined with another tool and then manually linked.

Here is an example of using multiple instances of the
Chart tool to show different time frames of the same stocks
selected from the scanner results.

Tools – Chart21
PAGE 22 TOOLS – SCANNER

Tools - Scanner

This is the full-blown, real-time scanner. Saved scans can
then be used as filters in other tools by using the ‘Scanner’
sub-tab in the Search bar.

Users can also add columns of data to the results list without applying any filters to make custom data tables that update in real time. These can then be filtered by any of the filters within Scanner.

Detailed information on each specific signal can be found in the
‘Help’ tab on the platform. Limited filters are available in the filters menu. Users can also use the different filtering methods via the
search bar. The notifications tab allows users to set notifications
for the signals selected. Signals can be saved as a config by clicking
the config area in the upper left.

Blue filter section of this tool has its own search bar to filter for a specific filter name

Refresh rate of this tool can be set by using the drop-down

Tool can be paused from updating by clicking the Pause button

Scans can be saved as a config by clicking the config area in the upper left

Users can adjust how many results they see, the source of the data, either stocks or crypto, or set notification options by clicking the gear cog in the upper right

Filters can be applied in various ways like sliders, custom entries, or dropdowns. These filters have their corresponding columns added to the results list.

Tools – Scanner22
PAGE 23 TOOLS – GRAPH

Tools - Graph

The Graph tool allows the user to build custom visualizations from Heatmaps of the overall market or a specific watchlist, to a Sankey or Waterfall graph for a company’s financials.

The chart type dictates what other fields are available. After a graph has been set up, this tool can be resized and linked to other tools as part of a larger workspace.

Here is an example of three heatmaps, one for the SPY, QQQ and DIA, used to create a ‘Market Overview’.

Here is an example of three instances of the tool added to a Details tool to create a Financial Statements overview.

Tools – Graph23
PAGE 24 TOOLS – BENZINGA AI

Tools - Benzinga AI

Benzinga AI is a ChatGPT-like tool focused on answering
questions about stocks, markets, and finance.

Users can prompt this to help with research, explain concepts, or observe trends and patterns.

Tools – Benzinga AI24
PAGE 25 TOOLS – CHAT

Tools - Chat

Benzinga AI is a ChatGPT-like tool focused on answering
questions about stocks, markets, and finance.

Users can prompt this to help with research, explain concepts, or observe trends and patterns.

The Chat tool allows the user to add the Chat to any workspace as a tool, instead of the traditional left and right docking afforded by the Chat icon

The content is exactly the same, no matter how it is selected.

Here is an example of how using the Chat tool in a workspace allows users to see multiple chat rooms at once.

Tools – Chat25
PAGE 26 TOOLS – RESEARCH

Tools - Research

The Research tool allows users to add a Research
subscription to a Benzinga Pro workspace.

NOTE:

You must be subscribed to one or more research services to make
use of this tool. Research subscriptions do not come
with Benzinga Pro.

Tools – Research26
PAGE 27 MORNING UPDATE

Morning Update

The Benzinga Morning Update includes a glance at:

Economic Data, Pre-Market Indices, Company Events,
Upcoming IPOs, Top Earnings, Analyst Initiations,
Upgrades, and Downgrades.

To access this content, click the profile icon in the upper right

It will look like this:

You can click on the gear cog at the top
of the morning update and toggle this page to load every day.

You can also add all the tickers in any
bucket to an existing watchlist
by clicking the watchlist button.

Morning Update27
PAGE 28 FINAL NOTES

Final Notes

Benzinga Pro is a premier research tool for uncovering
stock ideas and information. There is no one correct
way to use it. Additionally, do not feel as if you NEED
to use every function.

Start with what you need and add to it from there.
DO NOT EXPECT TO LEARN EVERYTHING ON DAY ONE.
This is a process of refinement.

Any tools not covered in this guide are either
third-party add-ons or tools that have
not been completely developed.

This platform was built from customer feedback.

If you have an idea of something we should add
or something we can do better, please suggest it!

You can select ‘Feedback’ from the menu in the upper right.

28