


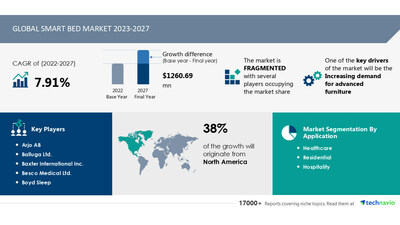
NEW YORK, June 2, 2023 /PRNewswire/ -- The smart bed market size is estimated to grow at a CAGR of 7.91% between 2022 and 2027. The market size is forecast to increase by USD 1,260.69 million. Increasing demand for advanced furniture is notably driving the smart bed market growth. In addition, the growing demand for advanced features and innovative beds has increased the need for smart beds. These aesthetically enhanced smart beds are easy to use and have a variety of features that make these beds perfect for relaxing. Discover some insights on market size historic period (2017 to 2021) and Forecast (2023 to 2027) before buying the full report - Request a sample report

What's New? -
- Special coverage on the Russia-Ukraine war; global inflation; recovery analysis from COVID-19; supply chain disruptions, global trade tensions; and risk of recession
- Global competitiveness and key competitor positions
- Market presence across multiple geographical footprints - Strong/Active/Niche/Trivial - Buy the report!
Global Smart bed market – Vendor Analysis
Vendor Landscape - The global smart bed market is fragmented, with the presence of several global as well as regional vendors. A few prominent vendors that offer smart bed in the market are Arjo AB, Balluga Ltd., Baxter International Inc., Besco Medical Ltd., Boyd Sleep, CVB Inc., Dires LLC, Eight Sleep Inc., Invacare Corp., IOF srl, Joerns Healthcare LLC, LINET Group SE, PARAMOUNT BED HOLDINGS Co. Ltd., ReST, Rize Home, SK Furniture and Decoraters, Sleep Number Corp., Stryker Corp., The Sleep Co., and Ultimate Smart Bed and others.
Vendor Offerings -
- Arjo AB: The company offers smart beds such as Prioma Medical Bed 600, Enterprise 8000X.
- Balluga Ltd.: The company focuses on offering smart interactive beds.
- Baxter International Inc.: The company offers smart beds through its subsidiary Hill Rom.
- For details on the vendor and its offerings – Request a sample report
Global Smart Bed Market - Segmentation Assessment
Segment Overview
Technavio has segmented the market based on Application (Healthcare, Residential, and Hospitality), Distribution Channel (Offline and Online), and Geography (North America, Europe, APAC, South America, and Middle East and Africa).
- The market share of the healthcare sector is expected to grow significantly during the forecast period. The market is growing as the use of smart beds in the medical field has increased and patient care in hospitals has become better and more focused. Hospitals primarily use smart beds to improve patient management and support patient recovery. The healthcare sector market is growing significantly due to continuous advancements in smart bed technology that enables hospitals to provide better care to their patients. Rising government spending on hospitals to deploy cutting-edge technologies and smart beds is expected to positively accelerate the market expansion during the forecast period.
Geography Overview
By geography, the global smart bed market is segmented into North America, Europe, APAC, South America, and Middle East and Africa. The report provides actionable insights and estimates the contribution of all regions to the growth of the global smart bed market.
- North America is estimated to contribute 38% to the growth of the global smart bed market during the forecast period. North America is gaining a large market share due to the rapid adoption of smart homes and rising demand for convenience and luxury. According to Houzz and Home's 10th annual survey of 70,000 U.S. residents, spending on home renovations, including kitchens, exteriors, and other fixtures and fittings, was USD 80,000 in 2019. , increased 15% to over USD 85,000 in 2020. People are spending money on home automation, security and other regulated amenities, and spending on smart home products like smart beds is on the rise. The smart bed can be connected to the Internet of Things (IoT), so the end user can control other smart home he devices such as TVs, coffee makers, thermostats and virtual assistants. With the spread of the Internet, the demand for smart beds is increasing in North America.
For insights on global, regional, and country-level parameters with growth opportunities from 2017 to 2027 - Download a Sample Report
Global Smart Bed Market – Market Dynamics
Leading Drivers - Increasing demand for advanced furniture is notably driving the smart bed market growth: The growing demand for advanced features and innovative beds has increased the need for smart beds. The aesthetically pleasing smart bed is easy to use and has a variety of features that are perfect for relaxing. The intelligent bed also has several other value-added features. For example, users can use it to warm their feet, work, or improve their health (and sleep) by improving their posture while sleeping.
The smart adjustable bed features smartphone connectivity, underbed lighting, multiple head and foot positions, and the ability to warm your feet. Such smart beds are gaining acceptance due to their easy-to-use interfaces, advanced features and beautiful designs. The advantages over non-smart/regular beds will attract more consumer purchases, leading to market growth during the forecast period.
Key Trends - Increasing integration of new features in smart beds is a key trend influencing the smart bed market growth: There is a growing trend to add new features to smart beds and help market players to acquire competitors to gain market share and enhance product functionality. For example, Sleep Number 360's latest smart his bed feature, My SleepHealth, aims to improve users' health and well-being by improving their sleep. This new technology feature shows users' sleep health trends on a weekly basis and provides actionable, personalized recommendations based on sleep duration, efficiency and timing.
My Sleep Health's data-driven insights are combined with other features that help users sleep better. Such new developments and innovations in the market are expected to increase investments and advancements and propel the growth of the market during the forecast period.
Major Challenges - The long product replacement cycle is challenging the smart bed market growth: High-quality branded furniture and furnishings (such as smart beds) do not need to be replaced frequently. A quality smart bed made of quality wood or steel will have a longer replacement cycle than a poorly made adjustable slatted frame or bed set. Large businesses operating in the United States and other North American countries must comply with American National Standards Institute (ANSI) and Business and Institutional Furniture Manufacturers Association (BIFMA) safety standards. Therefore, smart bed manufacturers must produce high-quality products with long replacement cycles to meet these standards. Therefore, high initial costs and long replacement cycles hinder the market.
What are the key data covered in this Smart Bed Market report?
- CAGR of the market during the forecast period
- Detailed information on factors that will drive the growth of the Smart Bed Market between 2023 and 2027
- Precise estimation of the size of the Smart Bed Market size and its contribution to the market in focus on the parent market
- Accurate predictions about upcoming trends and changes in consumer behavior
- Growth of the Smart Bed Market industry across North America, Europe, APAC, South America, and Middle East and Africa
- A thorough analysis of the market's competitive landscape and detailed information about vendors
- Comprehensive analysis of factors that will challenge the growth of Smart Bed Market vendors
Gain instant access to 17,000+ market research reports.
Technavio's SUBSCRIPTION platform
Related Reports:
The global bed and bath linen market is estimated to grow by USD 39.28 billion at a CAGR of 6.8% between 2022 and 2027. The bed and linen market is segmented by product (bed linen and bath linen), distribution channel (offline and online), and geography (APAC, North America, Europe, Middle East and Africa, and South America). To increase their product portfolio and widen their customer base, a number of local and global vendors operating in the global bed and bath linen market have started to focus on developing a wide range of high-quality products.
The Global Heated Bedding Market size is estimated to grow by USD 111.39 million between 2022 and 2027 accelerating at a CAGR of 4.1%. This electric blankets market research report extensively covers market segmentation by Product (heated blankets and throws and heated mattress pad), Distribution Channel (offline and online), and Geography (APAC, North America, Europe, South America, and Middle East and Africa). The demand for heated bedding products has increased due to the high level of product premiumization in the electric blanket market.
Smart Bed Market Scope | |
Report Coverage | Details |
Historic period | 2017-2021 |
Forecast period | 2023-2027 |
Growth momentum & CAGR | Accelerate at a CAGR of 7.91% |
Market growth 2023-2027 | USD 1,260.69 million |
Market structure | Fragmented |
YoY growth 2022-2023 (%) | 6.67 |
Regional analysis | North America, Europe, APAC, South America, and Middle East and Africa |
Performing market contribution | North America at 38% |
Key countries | US, Canada, Japan, Germany, and UK, Canada, Mexico, Italy,Spain, India, Japan, Australia, and South Korea |
Competitive landscape | Leading Vendors, Market Positioning of Vendors, Competitive Strategies, and Industry Risks |
Key companies profiled | Arjo AB, Balluga Ltd., Baxter International Inc., Besco Medical Ltd., Boyd Sleep, CVB Inc., Dires LLC, Eight Sleep Inc., Invacare Corp., IOF srl, Joerns Healthcare LLC, LINET Group SE, PARAMOUNT BED HOLDINGS Co. Ltd., ReST, Rize Home, SK Furniture and Decoraters, Sleep Number Corp., Stryker Corp., The Sleep Co., and Ultimate Smart Bed |
Market dynamics | Parent market analysis, Market growth inducers and obstacles, Fast-growing and slow-growing segment analysis, COVID-19 impact and recovery analysis and future consumer dynamics, Market condition analysis for forecast period. |
Customization purview | If our report has not included the data that you are looking for, you can reach out to our analysts and get segments customized. |
Table of Content
1 Executive Summary
- 1.1 Market overview
- Exhibit 01: Executive Summary – Chart on Market Overview
- Exhibit 02: Executive Summary – Data Table on Market Overview
- Exhibit 03: Executive Summary – Chart on Global Market Characteristics
- Exhibit 04: Executive Summary – Chart on Market by Geography
- Exhibit 05: Executive Summary – Chart on Market Segmentation by Application
- Exhibit 06: Executive Summary – Chart on Market Segmentation by Distribution Channel
- Exhibit 07: Executive Summary – Chart on Incremental Growth
- Exhibit 08: Executive Summary – Data Table on Incremental Growth
- Exhibit 09: Executive Summary – Chart on Vendor Market Positioning
2 Market Landscape
- 2.1 Market ecosystem
- Exhibit 10: Parent market
- Exhibit 11: Market Characteristics
3 Market Sizing
- 3.1 Market definition
- Exhibit 12: Offerings of vendors included in the market definition
- 3.2 Market segment analysis
- Exhibit 13: Market segments
- 3.3 Market size 2022
- 3.4 Market outlook: Forecast for 2022-2027
- Exhibit 14: Chart on Global - Market size and forecast 2022-2027 ($ million)
- Exhibit 15: Data Table on Global - Market size and forecast 2022-2027 ($ million)
- Exhibit 16: Chart on Global Market: Year-over-year growth 2022-2027 (%)
- Exhibit 17: Data Table on Global Market: Year-over-year growth 2022-2027 (%)
4 Historic Market Size
- 4.1 Global smart bed market 2017 - 2021
- Exhibit 18: Historic Market Size – Data Table on global smart bed market 2017 - 2021 ($ million)
- 4.2 Application Segment Analysis 2017 - 2021
- Exhibit 19: Historic Market Size – Application Segment 2017 - 2021 ($ million)
- 4.3 Distribution Channel Segment Analysis 2017 - 2021
- Exhibit 20: Historic Market Size – Distribution Channel Segment 2017 - 2021 ($ million)
- 4.4 Geography Segment Analysis 2017 - 2021
- Exhibit 21: Historic Market Size – Geography Segment 2017 - 2021 ($ million)
- 4.5 Country Segment Analysis 2017 - 2021
- Exhibit 22: Historic Market Size – Country Segment 2017 - 2021 ($ million)
5 Five Forces Analysis
- 5.1 Five forces summary
- Exhibit 23: Five forces analysis - Comparison between 2022 and 2027
- 5.2 Bargaining power of buyers
- Exhibit 24: Chart on Bargaining power of buyers – Impact of key factors 2022 and 2027
- 5.3 Bargaining power of suppliers
- Exhibit 25: Bargaining power of suppliers – Impact of key factors in 2022 and 2027
- 5.4 Threat of new entrants
- Exhibit 26: Threat of new entrants – Impact of key factors in 2022 and 2027
- 5.5 Threat of substitutes
- Exhibit 27: Threat of substitutes – Impact of key factors in 2022 and 2027
- 5.6 Threat of rivalry
- Exhibit 28: Threat of rivalry – Impact of key factors in 2022 and 2027
- 5.7 Market condition
- Exhibit 29: Chart on Market condition - Five forces 2022 and 2027
6 Market Segmentation by Application
- 6.1 Market segments
- Exhibit 30: Chart on Application - Market share 2022-2027 (%)
- Exhibit 31: Data Table on Application - Market share 2022-2027 (%)
- 6.2 Comparison by Application
- Exhibit 32: Chart on Comparison by Application
- Exhibit 33: Data Table on Comparison by Application
- 6.3 Healthcare - Market size and forecast 2022-2027
- Exhibit 34: Chart on Healthcare - Market size and forecast 2022-2027 ($ million)
- Exhibit 35: Data Table on Healthcare - Market size and forecast 2022-2027 ($ million)
- Exhibit 36: Chart on Healthcare - Year-over-year growth 2022-2027 (%)
- Exhibit 37: Data Table on Healthcare - Year-over-year growth 2022-2027 (%)
- 6.4 Residential - Market size and forecast 2022-2027
- Exhibit 38: Chart on Residential - Market size and forecast 2022-2027 ($ million)
- Exhibit 39: Data Table on Residential - Market size and forecast 2022-2027 ($ million)
- Exhibit 40: Chart on Residential - Year-over-year growth 2022-2027 (%)
- Exhibit 41: Data Table on Residential - Year-over-year growth 2022-2027 (%)
- 6.5 Hospitality - Market size and forecast 2022-2027
- Exhibit 42: Chart on Hospitality - Market size and forecast 2022-2027 ($ million)
- Exhibit 43: Data Table on Hospitality - Market size and forecast 2022-2027 ($ million)
- Exhibit 44: Chart on Hospitality - Year-over-year growth 2022-2027 (%)
- Exhibit 45: Data Table on Hospitality - Year-over-year growth 2022-2027 (%)
- 6.6 Market opportunity by Application
- Exhibit 46: Market opportunity by Application ($ million)
- Exhibit 47: Data Table on Market opportunity by Application ($ million)
7 Market Segmentation by Distribution Channel
- 7.1 Market segments
- Exhibit 48: Chart on Distribution Channel - Market share 2022-2027 (%)
- Exhibit 49: Data Table on Distribution Channel - Market share 2022-2027 (%)
- 7.2 Comparison by Distribution Channel
- Exhibit 50: Chart on Comparison by Distribution Channel
- Exhibit 51: Data Table on Comparison by Distribution Channel
- 7.3 Offline - Market size and forecast 2022-2027
- Exhibit 52: Chart on Offline - Market size and forecast 2022-2027 ($ million)
- Exhibit 53: Data Table on Offline - Market size and forecast 2022-2027 ($ million)
- Exhibit 54: Chart on Offline - Year-over-year growth 2022-2027 (%)
- Exhibit 55: Data Table on Offline - Year-over-year growth 2022-2027 (%)
- 7.4 Online - Market size and forecast 2022-2027
- Exhibit 56: Chart on Online - Market size and forecast 2022-2027 ($ million)
- Exhibit 57: Data Table on Online - Market size and forecast 2022-2027 ($ million)
- Exhibit 58: Chart on Online - Year-over-year growth 2022-2027 (%)
- Exhibit 59: Data Table on Online - Year-over-year growth 2022-2027 (%)
- 7.5 Market opportunity by Distribution Channel
- Exhibit 60: Market opportunity by Distribution Channel ($ million)
- Exhibit 61: Data Table on Market opportunity by Distribution Channel ($ million)
8 Customer Landscape
- 8.1 Customer landscape overview
- Exhibit 62: Analysis of price sensitivity, lifecycle, customer purchase basket, adoption rates, and purchase criteria
9 Geographic Landscape
- 9.1 Geographic segmentation
- Exhibit 63: Chart on Market share by geography 2022-2027 (%)
- Exhibit 64: Data Table on Market share by geography 2022-2027 (%)
- 9.2 Geographic comparison
- Exhibit 65: Chart on Geographic comparison
- Exhibit 66: Data Table on Geographic comparison
- 9.3 North America - Market size and forecast 2022-2027
- Exhibit 67: Chart on North America - Market size and forecast 2022-2027 ($ million)
- Exhibit 68: Data Table on North America - Market size and forecast 2022-2027 ($ million)
- Exhibit 69: Chart on North America - Year-over-year growth 2022-2027 (%)
- Exhibit 70: Data Table on North America - Year-over-year growth 2022-2027 (%)
- 9.4 Europe - Market size and forecast 2022-2027
- Exhibit 71: Chart on Europe - Market size and forecast 2022-2027 ($ million)
- Exhibit 72: Data Table on Europe - Market size and forecast 2022-2027 ($ million)
- Exhibit 73: Chart on Europe - Year-over-year growth 2022-2027 (%)
- Exhibit 74: Data Table on Europe - Year-over-year growth 2022-2027 (%)
- 9.5 APAC - Market size and forecast 2022-2027
- Exhibit 75: Chart on APAC - Market size and forecast 2022-2027 ($ million)
- Exhibit 76: Data Table on APAC - Market size and forecast 2022-2027 ($ million)
- Exhibit 77: Chart on APAC - Year-over-year growth 2022-2027 (%)
- Exhibit 78: Data Table on APAC - Year-over-year growth 2022-2027 (%)
- 9.6 South America - Market size and forecast 2022-2027
- Exhibit 79: Chart on South America - Market size and forecast 2022-2027 ($ million)
- Exhibit 80: Data Table on South America - Market size and forecast 2022-2027 ($ million)
- Exhibit 81: Chart on South America - Year-over-year growth 2022-2027 (%)
- Exhibit 82: Data Table on South America - Year-over-year growth 2022-2027 (%)
- 9.7 Middle East and Africa - Market size and forecast 2022-2027
- Exhibit 83: Chart on Middle East and Africa - Market size and forecast 2022-2027 ($ million)
- Exhibit 84: Data Table on Middle East and Africa - Market size and forecast 2022-2027 ($ million)
- Exhibit 85: Chart on Middle East and Africa - Year-over-year growth 2022-2027 (%)
- Exhibit 86: Data Table on Middle East and Africa - Year-over-year growth 2022-2027 (%)
- 9.8 US - Market size and forecast 2022-2027
- Exhibit 87: Chart on US - Market size and forecast 2022-2027 ($ million)
- Exhibit 88: Data Table on US - Market size and forecast 2022-2027 ($ million)
- Exhibit 89: Chart on US - Year-over-year growth 2022-2027 (%)
- Exhibit 90: Data Table on US - Year-over-year growth 2022-2027 (%)
- 9.9 Germany - Market size and forecast 2022-2027
- Exhibit 91: Chart on Germany - Market size and forecast 2022-2027 ($ million)
- Exhibit 92: Data Table on Germany - Market size and forecast 2022-2027 ($ million)
- Exhibit 93: Chart on Germany - Year-over-year growth 2022-2027 (%)
- Exhibit 94: Data Table on Germany - Year-over-year growth 2022-2027 (%)
- 9.10 Canada - Market size and forecast 2022-2027
- Exhibit 95: Chart on Canada - Market size and forecast 2022-2027 ($ million)
- Exhibit 96: Data Table on Canada - Market size and forecast 2022-2027 ($ million)
- Exhibit 97: Chart on Canada - Year-over-year growth 2022-2027 (%)
- Exhibit 98: Data Table on Canada - Year-over-year growth 2022-2027 (%)
- 9.11 UK - Market size and forecast 2022-2027
- Exhibit 99: Chart on UK - Market size and forecast 2022-2027 ($ million)
- Exhibit 100: Data Table on UK - Market size and forecast 2022-2027 ($ million)
- Exhibit 101: Chart on UK - Year-over-year growth 2022-2027 (%)
- Exhibit 102: Data Table on UK - Year-over-year growth 2022-2027 (%)
- 9.12 Japan - Market size and forecast 2022-2027
- Exhibit 103: Chart on Japan - Market size and forecast 2022-2027 ($ million)
- Exhibit 104: Data Table on Japan - Market size and forecast 2022-2027 ($ million)
- Exhibit 105: Chart on Japan - Year-over-year growth 2022-2027 (%)
- Exhibit 106: Data Table on Japan - Year-over-year growth 2022-2027 (%)
- 9.13 Market opportunity by geography
- Exhibit 107: Market opportunity by geography ($ million)
- Exhibit 108: Data Tables on Market opportunity by geography ($ million)
10 Drivers, Challenges, and Trends
- 10.1 Market drivers
- 10.2 Market challenges
- 10.3 Impact of drivers and challenges
- Exhibit 109: Impact of drivers and challenges in 2022 and 2027
- 10.4 Market trends
11 Vendor Landscape
- 11.1 Overview
- 11.2 Vendor landscape
- Exhibit 110: Overview on Criticality of inputs and Factors of differentiation
- 11.3 Landscape disruption
- Exhibit 111: Overview on factors of disruption
- 11.4 Industry risks
- Exhibit 112: Impact of key risks on business
12 Vendor Analysis
- 12.1 Vendors covered
- Exhibit 113: Vendors covered
- 12.2 Market positioning of vendors
- Exhibit 114: Matrix on vendor position and classification
- 12.3 Arjo AB
- Exhibit 115: Arjo AB - Overview
- Exhibit 116: Arjo AB - Business segments
- Exhibit 117: Arjo AB - Key news
- Exhibit 118: Arjo AB - Key offerings
- Exhibit 119: Arjo AB - Segment focus
- 12.4 Balluga Ltd.
- Exhibit 120: Balluga Ltd. - Overview
- Exhibit 121: Balluga Ltd. - Product / Service
- Exhibit 122: Balluga Ltd. - Key offerings
- 12.5 Baxter International Inc.
- Exhibit 123: Baxter International Inc. - Overview
- Exhibit 124: Baxter International Inc. - Business segments
- Exhibit 125: Baxter International Inc. - Key news
- Exhibit 126: Baxter International Inc. - Key offerings
- Exhibit 127: Baxter International Inc. - Segment focus
- 12.6 Besco Medical Ltd.
- Exhibit 128: Besco Medical Ltd. - Overview
- Exhibit 129: Besco Medical Ltd. - Product / Service
- Exhibit 130: Besco Medical Ltd. - Key offerings
- 12.7 Invacare Corp.
- Exhibit 131: Invacare Corp. - Overview
- Exhibit 132: Invacare Corp. - Business segments
- Exhibit 133: Invacare Corp. - Key news
- Exhibit 134: Invacare Corp. - Key offerings
- Exhibit 135: Invacare Corp. - Segment focus
- 12.8 IOF srl
- Exhibit 136: IOF srl - Overview
- Exhibit 137: IOF srl - Product / Service
- Exhibit 138: IOF srl - Key offerings
- 12.9 Joerns Healthcare LLC
- Exhibit 139: Joerns Healthcare LLC - Overview
- Exhibit 140: Joerns Healthcare LLC - Product / Service
- Exhibit 141: Joerns Healthcare LLC - Key offerings
- 12.10 LINET Group SE
- Exhibit 142: LINET Group SE - Overview
- Exhibit 143: LINET Group SE - Product / Service
- Exhibit 144: LINET Group SE - Key offerings
- 12.11 PARAMOUNT BED HOLDINGS Co. Ltd.
- Exhibit 145: PARAMOUNT BED HOLDINGS Co. Ltd. - Overview
- Exhibit 146: PARAMOUNT BED HOLDINGS Co. Ltd. - Business segments
- Exhibit 147: PARAMOUNT BED HOLDINGS Co. Ltd. - Key offerings
- Exhibit 148: PARAMOUNT BED HOLDINGS Co. Ltd. - Segment focus
- 12.12 ReST
- Exhibit 149: ReST - Overview
- Exhibit 150: ReST - Product / Service
- Exhibit 151: ReST - Key offerings
- 12.13 SK Furniture and Decoraters
- Exhibit 152: SK Furniture and Decoraters - Overview
- Exhibit 153: SK Furniture and Decoraters - Product / Service
- Exhibit 154: SK Furniture and Decoraters - Key offerings
- 12.14 Sleep Number Corp.
- Exhibit 155: Sleep Number Corp. - Overview
- Exhibit 156: Sleep Number Corp. - Product / Service
- Exhibit 157: Sleep Number Corp. - Key offerings
- 12.15 Stryker Corp.
- Exhibit 158: Stryker Corp. - Overview
- Exhibit 159: Stryker Corp. - Business segments
- Exhibit 160: Stryker Corp. - Key news
- Exhibit 161: Stryker Corp. - Key offerings
- Exhibit 162: Stryker Corp. - Segment focus
- 12.16 The Sleep Co.
- Exhibit 163: The Sleep Co. - Overview
- Exhibit 164: The Sleep Co. - Product / Service
- Exhibit 165: The Sleep Co. - Key offerings
- 12.17 Ultimate Smart Bed
- Exhibit 166: Ultimate Smart Bed - Overview
- Exhibit 167: Ultimate Smart Bed - Product / Service
- Exhibit 168: Ultimate Smart Bed - Key offerings
13 Appendix
- 13.1 Scope of the report
- 13.2 Inclusions and exclusions checklist
- Exhibit 169: Inclusions checklist
- Exhibit 170: Exclusions checklist
- 13.3 Currency conversion rates for US$
- Exhibit 171: Currency conversion rates for US$
- 13.4 Research methodology
- Exhibit 172: Research methodology
- Exhibit 173: Validation techniques employed for market sizing
- Exhibit 174: Information sources
- 13.5 List of abbreviations
- Exhibit 175: List of abbreviations
About Us
Technavio is a leading global technology research and advisory company. Their research and analysis focuses on emerging market trends and provides actionable insights to help businesses identify market opportunities and develop effective strategies to optimize their market positions. With over 500 specialized analysts, Technavio's report library consists of more than 17,000 reports and counting, covering 800 technologies, spanning across 50 countries. Their client base consists of enterprises of all sizes, including more than 100 Fortune 500 companies. This growing client base relies on Technavio's comprehensive coverage, extensive research, and actionable market insights to identify opportunities in existing and potential markets and assess their competitive positions within changing market scenarios.
Contact
Technavio Research
Jesse Maida
Media & Marketing Executive
US: +1 844 364 1100
UK: +44 203 893 3200
Email: media@technavio.com
Website: www.technavio.com/


SOURCE Technavio
© 2024 Benzinga.com. Benzinga does not provide investment advice. All rights reserved.
Trade confidently with insights and alerts from analyst ratings, free reports and breaking news that affects the stocks you care about.

