


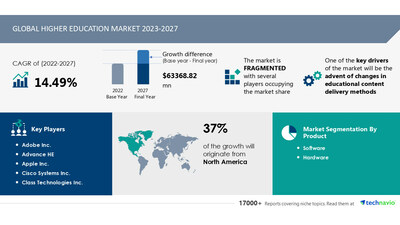
NEW YORK, March 31, 2023 /PRNewswire/ -- The higher education market size is estimated to grow by USD 63,368.82 million from 2022 to 2027. The market will progress at a CAGR of 14.49% during the forecast period. A major factor fueling the higher education market growth is the advent of changes in educational content delivery methods. Various established technologies, including hybrid or collaborative learning platforms, have been utilized for higher education globally. The implementation of new technologies for education was led by the increase in the investment by colleges and universities in hardware and software. The market has witnessed an emergence of new forms of content delivery methods that involve new technologies such as gamification-supported flipped classrooms and active learning, which can help enhance student engagement and make the learning process student-centric. Gamification-supported flipped classroom is a technology that enables students to watch videos and online lectures outside the classroom. This technology helps in remodeling lengthy lecture sessions into active learning, thereby utilizing the valuable class time of students to solve problems and apply concepts. Hence, technological advances fuel the growth of the higher education market during the forecast period. Discover some insights on market size, historic period (2017 to 2021), and forecast market data (2023-2027) before buying the full report - Request a sample report

Higher education market – Vendor Analysis
Vendor Landscape - The global higher education market is fragmented, with the presence of several global as well as regional vendors. A few prominent vendors that offer higher education in the market are Adobe Inc., Advance HE, Apple Inc., Cisco Systems Inc., Class Technologies Inc., D2L Corp., Dell Technologies Inc., Educomp Solutions Ltd., Ellucian Co. LP, Fujitsu Ltd., Instructure Holdings Inc., International Business Machines Corp., Jenzabar Inc., Microsoft Corp., Oracle Corp., Pearson Plc, Promethean Ltd., Samsung Electronics Co. Ltd., SMART Technologies ULC, and Xerox Holdings Corp. and others.
What's New? -
- Special coverage on the Russia-Ukraine war; global inflation; recovery analysis from COVID-19; supply chain disruptions, global trade tensions; and risk of recession
- Global competitiveness and key competitor positions
- Market presence across multiple geographical footprints - Strong/Active/Niche/Trivial - Buy the report!
Vendor Offerings -
- Adobe Inc. - The company offers higher education solutions such as Creative Cloud.
- Apple Inc. - The company offers higher education solutions through Macbook Pro, iPad Pro, and Apple Pencil.
- D2L Corp. - The company offers higher education solutions such as Brightspace Learning Management System.
- For details on the vendor and their offerings – Request a sample report
Higher Education Market - Segmentation Assessment
Segment Overview
Technavio has segmented the market based on the product (software and hardware), end-user (private colleges, state universities, and community colleges), and geography (North America, Europe, APAC, South America, and Middle East and Africa).
- The market share growth by the software segment will be significant during the forecast period. The higher education software segment is further segmented into support and solutions. The solutions subsegment includes learning management systems (LMSs), enterprise resource planning (ERP), adaptive learning software (ALS), content management systems (CMSs), and others. The global higher education software market is expected to witness a steady growth rate during the forecast period. The rise in the demand for various higher education software is led by factors such as the shift in the focus of higher education institutions toward active learning techniques and changes in educational content delivery methods. The demand for cloud-based classroom management system software in the higher education sector is high because of its ease of integration with the existing LMS and other supporting software such as CMS. Moreover, global vendors of technologies such as learning analytics, gamification solutions, assessment tools, and content authoring are expected to grow and capitalize on the opportunity during the forecast period.
Geography Overview
By geography, the global higher education market is segmented into North America, Europe, APAC, South America, and Middle East and Africa. The report provides actionable insights and estimates the contribution of all regions to the growth of the global higher education market.
- North America is estimated to account for 37% of the growth of the global higher education market during the forecast period. The growth can be attributed to factors such as the growing need for effective and quality education in the developed economies in the region. Higher education institutions are investing in modern technologies that can be used to improve the learning experience for students as well as enable educators to deliver and access content from anywhere at any given point in time.
For insights on global, regional, and country-level parameters with growth opportunities
from 2017 to 2027 - Download a Sample Report
Higher Education Market – Market Dynamics
Key Trends -
The rising emphasis on technology-based course delivery is a major trend in the global higher education market. New models of higher education partnerships such as transitional education (TNE) have emerged. TNE is conducted using different modes such as twinning programs, distance education, articulation programs, franchising arrangements, and branch campuses. The rise in the demand among students to gain a foreign qualification without moving from their country of residence is driving the growth of TNE. This helps employers and governments look for options for human resource development with a geographically dispersed workforce. Hence, the growth of TNE across the globe is likely to stimulate the growth of the global higher education market.
Major challenges -
The growth in the cost of higher education is one of the challenges hindering the higher education market growth. The rise in the cost of higher education discourages potential customers such as students. The cost of higher education is very high in private colleges compared with government colleges. For instance, the average tuition fee in private, nonprofit, and four-year colleges has increased significantly, leading to a reduction in the total number of college enrollments. The lack of well-paying job opportunities also makes students reluctant to pay high fees. Furthermore, young adults are facing high student debt. The enrollment rates for higher education are severely dropping among low-income students. Hence, factors such as high costs are expected to impede the market growth for higher education during the forecast period.
What are the key data covered in this Higher Education Market report?
- CAGR of the market during the forecast period
- Detailed information on factors that will drive the growth of the higher education market between 2023 and 2027
- Precise estimation of the size of the higher education market and its contribution to the parent market
- Accurate predictions about upcoming trends and changes in consumer behavior
- Growth of the higher education market across North America, Europe, APAC, South America, and Middle East and Africa
- A thorough analysis of the market's competitive landscape and detailed information about vendors
- Comprehensive analysis of factors that will challenge the growth of higher education market vendors
Gain instant access to 17,000+ market research reports.
Technavio's SUBSCRIPTION platform
Related Reports:
The online photography education market in the higher education market size is expected to increase by USD 655.08 million from 2021 to 2026, and the market's growth momentum will accelerate at a CAGR of 7.08%. The growing advantages of online learning are a key factor driving the global online photography education market in higher education market share growth.
The higher education market in Vietnam is estimated to grow at a CAGR of 15.3% between 2022 and 2027 and the size of the market is forecast to increase by USD 481.32 million. The advent of changes in educational content delivery methods is driving the market growth.
Higher Education Market Scope | |
Report Coverage | Details |
Historic period | 2017-2021 |
Base Year | 2022 |
Forecast period | 2023-2027 |
Growth momentum & CAGR | Accelerate at a CAGR of 14.49% |
Market growth 2023-2027 | USD 63,368.82 million |
Market structure | Fragmented |
YoY growth 2022-2023 (%) | 13.96 |
Regional analysis | North America, Europe, APAC, South America, and Middle East and Africa |
Performing market contribution | North America at 37% |
Key countries | US, China, India, Germany, and UK |
Competitive landscape | Leading Vendors, Market Positioning of Vendors, Competitive Strategies, and Industry Risks |
Key companies profiled | Adobe Inc., Advance HE, Apple Inc., Cisco Systems Inc., Class Technologies Inc., D2L Corp., Dell Technologies Inc., Educomp Solutions Ltd., Ellucian Co. LP, Fujitsu Ltd., Instructure Holdings Inc., International Business Machines Corp., Jenzabar Inc., Microsoft Corp., Oracle Corp., Pearson Plc, Promethean Ltd., Samsung Electronics Co. Ltd., SMART Technologies ULC, and Xerox Holdings Corp. |
Market dynamics | Parent market analysis, Market growth inducers and obstacles, Fast-growing and slow-growing segment analysis, COVID-19 impact and recovery analysis and future consumer dynamics, Market condition analysis for the forecast period |
Customization purview | If our report has not included the data that you are looking for, you can reach out to our analysts and get segments customized. |
Browse for Technavio Consumer Discretionary market reports
Table of Contents
1 Executive Summary
- 1.1 Market overview
- Exhibit 01: Executive Summary – Chart on Market Overview
- Exhibit 02: Executive Summary – Data Table on Market Overview
- Exhibit 03: Executive Summary – Chart on Global Market Characteristics
- Exhibit 04: Executive Summary – Chart on Market by Geography
- Exhibit 05: Executive Summary – Chart on Market Segmentation by Product
- Exhibit 06: Executive Summary – Chart on Market Segmentation by End-user
- Exhibit 07: Executive Summary – Chart on Incremental Growth
- Exhibit 08: Executive Summary – Data Table on Incremental Growth
- Exhibit 09: Executive Summary – Chart on Vendor Market Positioning
2 Market Landscape
- 2.1 Market ecosystem
- Exhibit 10: Parent market
- Exhibit 11: Market Characteristics
3 Market Sizing
- 3.1 Market definition
- Exhibit 12: Offerings of vendors included in the market definition
- 3.2 Market segment analysis
- Exhibit 13: Market segments
- 3.3 Market size 2022
- 3.4 Market outlook: Forecast for 2022-2027
- Exhibit 14: Chart on Global - Market size and forecast 2022-2027 ($ million)
- Exhibit 15: Data Table on Global - Market size and forecast 2022-2027 ($ million)
- Exhibit 16: Chart on Global Market: Year-over-year growth 2022-2027 (%)
- Exhibit 17: Data Table on Global Market: Year-over-year growth 2022-2027 (%)
4 Historic Market Size
- 4.1 Global higher education market 2017 - 2021
- Exhibit 18: Historic Market Size – Data Table on Global higher education market 2017 - 2021 ($ million)
- 4.2 Product Segment Analysis 2017 - 2021
- Exhibit 19: Historic Market Size – Product Segment 2017 - 2021 ($ million)
- 4.3 End-User Segment Analysis 2017 - 2021
- Exhibit 20: Historic Market Size – End-User Segment 2017 - 2021 ($ million)
- 4.4 Geography Segment Analysis 2017 - 2021
- Exhibit 21: Historic Market Size – Geography Segment 2017 - 2021 ($ million)
- 4.5 Country Segment Analysis 2017 - 2021
- Exhibit 22: Historic Market Size – Country Segment 2017 - 2021 ($ million)
5 Five Forces Analysis
- 5.1 Five forces summary
- Exhibit 23: Five forces analysis - Comparison between 2022 and 2027
- 5.2 Bargaining power of buyers
- Exhibit 24: Chart on Bargaining power of buyers – Impact of key factors 2022 and 2027
- 5.3 Bargaining power of suppliers
- Exhibit 25: Bargaining power of suppliers – Impact of key factors in 2022 and 2027
- 5.4 Threat of new entrants
- Exhibit 26: Threat of new entrants – Impact of key factors in 2022 and 2027
- 5.5 Threat of substitutes
- Exhibit 27: Threat of substitutes – Impact of key factors in 2022 and 2027
- 5.6 Threat of rivalry
- Exhibit 28: Threat of rivalry – Impact of key factors in 2022 and 2027
- 5.7 Market condition
- Exhibit 29: Chart on Market condition - Five forces 2022 and 2027
6 Market Segmentation by Product
- 6.1 Market segments
- Exhibit 30: Chart on Product - Market share 2022-2027 (%)
- Exhibit 31: Data Table on Product - Market share 2022-2027 (%)
- 6.2 Comparison by Product
- Exhibit 32: Chart on Comparison by Product
- Exhibit 33: Data Table on Comparison by Product
- 6.3 Software - Market size and forecast 2022-2027
- Exhibit 34: Chart on Software - Market size and forecast 2022-2027 ($ million)
- Exhibit 35: Data Table on Software - Market size and forecast 2022-2027 ($ million)
- Exhibit 36: Chart on Software - Year-over-year growth 2022-2027 (%)
- Exhibit 37: Data Table on Software - Year-over-year growth 2022-2027 (%)
- 6.4 Hardware - Market size and forecast 2022-2027
- Exhibit 38: Chart on Hardware - Market size and forecast 2022-2027 ($ million)
- Exhibit 39: Data Table on Hardware - Market size and forecast 2022-2027 ($ million)
- Exhibit 40: Chart on Hardware - Year-over-year growth 2022-2027 (%)
- Exhibit 41: Data Table on Hardware - Year-over-year growth 2022-2027 (%)
- 6.5 Market opportunity by Product
- Exhibit 42: Market opportunity by Product ($ million)
7 Market Segmentation by End-user
- 7.1 Market segments
- Exhibit 43: Chart on End-user - Market share 2022-2027 (%)
- Exhibit 44: Data Table on End-user - Market share 2022-2027 (%)
- 7.2 Comparison by End-user
- Exhibit 45: Chart on Comparison by End-user
- Exhibit 46: Data Table on Comparison by End-user
- 7.3 Private colleges - Market size and forecast 2022-2027
- Exhibit 47: Chart on Private colleges - Market size and forecast 2022-2027 ($ million)
- Exhibit 48: Data Table on Private colleges - Market size and forecast 2022-2027 ($ million)
- Exhibit 49: Chart on Private colleges - Year-over-year growth 2022-2027 (%)
- Exhibit 50: Data Table on Private colleges - Year-over-year growth 2022-2027 (%)
- 7.4 State universities - Market size and forecast 2022-2027
- Exhibit 51: Chart on State universities - Market size and forecast 2022-2027 ($ million)
- Exhibit 52: Data Table on State universities - Market size and forecast 2022-2027 ($ million)
- Exhibit 53: Chart on State universities - Year-over-year growth 2022-2027 (%)
- Exhibit 54: Data Table on State universities - Year-over-year growth 2022-2027 (%)
- 7.5 Community colleges - Market size and forecast 2022-2027
- Exhibit 55: Chart on Community colleges - Market size and forecast 2022-2027 ($ million)
- Exhibit 56: Data Table on Community colleges - Market size and forecast 2022-2027 ($ million)
- Exhibit 57: Chart on Community colleges - Year-over-year growth 2022-2027 (%)
- Exhibit 58: Data Table on Community colleges - Year-over-year growth 2022-2027 (%)
- 7.6 Market opportunity by End-user
- Exhibit 59: Market opportunity by End-user ($ million)
8 Customer Landscape
- 8.1 Customer landscape overview
- Exhibit 60: Analysis of price sensitivity, lifecycle, customer purchase basket, adoption rates, and purchase criteria
9 Geographic Landscape
- 9.1 Geographic segmentation
- Exhibit 61: Chart on Market share by geography 2022-2027 (%)
- Exhibit 62: Data Table on Market share by geography 2022-2027 (%)
- 9.2 Geographic comparison
- Exhibit 63: Chart on Geographic comparison
- Exhibit 64: Data Table on Geographic comparison
- 9.3 North America - Market size and forecast 2022-2027
- Exhibit 65: Chart on North America - Market size and forecast 2022-2027 ($ million)
- Exhibit 66: Data Table on North America - Market size and forecast 2022-2027 ($ million)
- Exhibit 67: Chart on North America - Year-over-year growth 2022-2027 (%)
- Exhibit 68: Data Table on North America - Year-over-year growth 2022-2027 (%)
- 9.4 Europe - Market size and forecast 2022-2027
- Exhibit 69: Chart on Europe - Market size and forecast 2022-2027 ($ million)
- Exhibit 70: Data Table on Europe - Market size and forecast 2022-2027 ($ million)
- Exhibit 71: Chart on Europe - Year-over-year growth 2022-2027 (%)
- Exhibit 72: Data Table on Europe - Year-over-year growth 2022-2027 (%)
- 9.5 APAC - Market size and forecast 2022-2027
- Exhibit 73: Chart on APAC - Market size and forecast 2022-2027 ($ million)
- Exhibit 74: Data Table on APAC - Market size and forecast 2022-2027 ($ million)
- Exhibit 75: Chart on APAC - Year-over-year growth 2022-2027 (%)
- Exhibit 76: Data Table on APAC - Year-over-year growth 2022-2027 (%)
- 9.6 South America - Market size and forecast 2022-2027
- Exhibit 77: Chart on South America - Market size and forecast 2022-2027 ($ million)
- Exhibit 78: Data Table on South America - Market size and forecast 2022-2027 ($ million)
- Exhibit 79: Chart on South America - Year-over-year growth 2022-2027 (%)
- Exhibit 80: Data Table on South America - Year-over-year growth 2022-2027 (%)
- 9.7 Middle East and Africa - Market size and forecast 2022-2027
- Exhibit 81: Chart on Middle East and Africa - Market size and forecast 2022-2027 ($ million)
- Exhibit 82: Data Table on Middle East and Africa - Market size and forecast 2022-2027 ($ million)
- Exhibit 83: Chart on Middle East and Africa - Year-over-year growth 2022-2027 (%)
- Exhibit 84: Data Table on Middle East and Africa - Year-over-year growth 2022-2027 (%)
- 9.8 US - Market size and forecast 2022-2027
- Exhibit 85: Chart on US - Market size and forecast 2022-2027 ($ million)
- Exhibit 86: Data Table on US - Market size and forecast 2022-2027 ($ million)
- Exhibit 87: Chart on US - Year-over-year growth 2022-2027 (%)
- Exhibit 88: Data Table on US - Year-over-year growth 2022-2027 (%)
- 9.9 Germany - Market size and forecast 2022-2027
- Exhibit 89: Chart on Germany - Market size and forecast 2022-2027 ($ million)
- Exhibit 90: Data Table on Germany - Market size and forecast 2022-2027 ($ million)
- Exhibit 91: Chart on Germany - Year-over-year growth 2022-2027 (%)
- Exhibit 92: Data Table on Germany - Year-over-year growth 2022-2027 (%)
- 9.10 China - Market size and forecast 2022-2027
- Exhibit 93: Chart on China - Market size and forecast 2022-2027 ($ million)
- Exhibit 94: Data Table on China - Market size and forecast 2022-2027 ($ million)
- Exhibit 95: Chart on China - Year-over-year growth 2022-2027 (%)
- Exhibit 96: Data Table on China - Year-over-year growth 2022-2027 (%)
- 9.11 UK - Market size and forecast 2022-2027
- Exhibit 97: Chart on UK - Market size and forecast 2022-2027 ($ million)
- Exhibit 98: Data Table on UK - Market size and forecast 2022-2027 ($ million)
- Exhibit 99: Chart on UK - Year-over-year growth 2022-2027 (%)
- Exhibit 100: Data Table on UK - Year-over-year growth 2022-2027 (%)
- 9.12 India - Market size and forecast 2022-2027
- Exhibit 101: Chart on India - Market size and forecast 2022-2027 ($ million)
- Exhibit 102: Data Table on India - Market size and forecast 2022-2027 ($ million)
- Exhibit 103: Chart on India - Year-over-year growth 2022-2027 (%)
- Exhibit 104: Data Table on India - Year-over-year growth 2022-2027 (%)
- 9.13 Market opportunity by geography
- Exhibit 105: Market opportunity by geography ($ million)
10 Drivers, Challenges, and Trends
- 10.1 Market drivers
- 10.2 Market challenges
- 10.3 Impact of drivers and challenges
- Exhibit 106: Impact of drivers and challenges in 2022 and 2027
- 10.4 Market trends
11 Vendor Landscape
- 11.1 Overview
- 11.2 Vendor landscape
- Exhibit 107: Overview on Criticality of inputs and Factors of differentiation
- 11.3 Landscape disruption
- Exhibit 108: Overview on factors of disruption
- 11.4 Industry risks
- Exhibit 109: Impact of key risks on business
12 Vendor Analysis
- 12.1 Vendors covered
- Exhibit 110: Vendors covered
- 12.2 Market positioning of vendors
- Exhibit 111: Matrix on vendor position and classification
- 12.3 Adobe Inc.
- Exhibit 112: Adobe Inc. - Overview
- Exhibit 113: Adobe Inc. - Business segments
- Exhibit 114: Adobe Inc. - Key news
- Exhibit 115: Adobe Inc. - Key offerings
- Exhibit 116: Adobe Inc. - Segment focus
- 12.4 Advance HE
- Exhibit 117: Advance HE - Overview
- Exhibit 118: Advance HE - Product / Service
- Exhibit 119: Advance HE - Key offerings
- 12.5 Apple Inc.
- Exhibit 120: Apple Inc. - Overview
- Exhibit 121: Apple Inc. - Business segments
- Exhibit 122: Apple Inc. - Key news
- Exhibit 123: Apple Inc. - Key offerings
- Exhibit 124: Apple Inc. - Segment focus
- 12.6 Cisco Systems Inc.
- Exhibit 125: Cisco Systems Inc. - Overview
- Exhibit 126: Cisco Systems Inc. - Business segments
- Exhibit 127: Cisco Systems Inc. - Key news
- Exhibit 128: Cisco Systems Inc. - Key offerings
- Exhibit 129: Cisco Systems Inc. - Segment focus
- 12.7 Class Technologies Inc.
- Exhibit 130: Class Technologies Inc. - Overview
- Exhibit 131: Class Technologies Inc. - Product / Service
- Exhibit 132: Class Technologies Inc. - Key offerings
- 12.8 D2L Corp.
- Exhibit 133: D2L Corp. - Overview
- Exhibit 134: D2L Corp. - Product / Service
- Exhibit 135: D2L Corp. - Key news
- Exhibit 136: D2L Corp. - Key offerings
- 12.9 Dell Technologies Inc.
- Exhibit 137: Dell Technologies Inc. - Overview
- Exhibit 138: Dell Technologies Inc. - Business segments
- Exhibit 139: Dell Technologies Inc. - Key news
- Exhibit 140: Dell Technologies Inc. - Key offerings
- Exhibit 141: Dell Technologies Inc. - Segment focus
- 12.10 Educomp Solutions Ltd.
- Exhibit 142: Educomp Solutions Ltd. - Overview
- Exhibit 143: Educomp Solutions Ltd. - Product / Service
- Exhibit 144: Educomp Solutions Ltd. - Key offerings
- 12.11 Ellucian Co. LP
- Exhibit 145: Ellucian Co. LP - Overview
- Exhibit 146: Ellucian Co. LP - Product / Service
- Exhibit 147: Ellucian Co. LP - Key offerings
- 12.12 Fujitsu Ltd.
- Exhibit 148: Fujitsu Ltd. - Overview
- Exhibit 149: Fujitsu Ltd. - Business segments
- Exhibit 150: Fujitsu Ltd. - Key news
- Exhibit 151: Fujitsu Ltd. - Key offerings
- Exhibit 152: Fujitsu Ltd. - Segment focus
- 12.13 Instructure Holdings Inc.
- Exhibit 153: Instructure Holdings Inc. - Overview
- Exhibit 154: Instructure Holdings Inc. - Product / Service
- Exhibit 155: Instructure Holdings Inc. - Key offerings
- 12.14 International Business Machines Corp.
- Exhibit 156: International Business Machines Corp. - Overview
- Exhibit 157: International Business Machines Corp. - Business segments
- Exhibit 158: International Business Machines Corp. - Key news
- Exhibit 159: International Business Machines Corp. - Key offerings
- Exhibit 160: International Business Machines Corp. - Segment focus
- 12.15 Microsoft Corp.
- Exhibit 161: Microsoft Corp. - Overview
- Exhibit 162: Microsoft Corp. - Business segments
- Exhibit 163: Microsoft Corp. - Key news
- Exhibit 164: Microsoft Corp. - Key offerings
- Exhibit 165: Microsoft Corp. - Segment focus
- 12.16 Pearson Plc
- Exhibit 166: Pearson Plc - Overview
- Exhibit 167: Pearson Plc - Business segments
- Exhibit 168: Pearson Plc - Key offerings
- Exhibit 169: Pearson Plc - Segment focus
- 12.17 Samsung Electronics Co. Ltd.
- Exhibit 170: Samsung Electronics Co. Ltd. - Overview
- Exhibit 171: Samsung Electronics Co. Ltd. - Business segments
- Exhibit 172: Samsung Electronics Co. Ltd. - Key news
- Exhibit 173: Samsung Electronics Co. Ltd. - Key offerings
- Exhibit 174: Samsung Electronics Co. Ltd. - Segment focus
13 Appendix
- 13.1 Scope of the report
- 13.2 Inclusions and exclusions checklist
- Exhibit 175: Inclusions checklist
- Exhibit 176: Exclusions checklist
- 13.3 Currency conversion rates for US$
- Exhibit 177: Currency conversion rates for US$
- 13.4 Research methodology
- Exhibit 178: Research methodology
- Exhibit 179: Validation techniques employed for market sizing
- Exhibit 180: Information sources
- 13.5 List of abbreviations
- Exhibit 181: List of abbreviations
About Us
Technavio is a leading global technology research and advisory company. Their research and analysis focus on emerging market trends and provide actionable insights to help businesses identify market opportunities and develop effective strategies to optimize their market positions. With over 500 specialized analysts, Technavio's report library consists of more than 17,000 reports and counting, covering 800 technologies, spanning across 50 countries. Their client base consists of enterprises of all sizes, including more than 100 Fortune 500 companies. This growing client base relies on Technavio's comprehensive coverage, extensive research, and actionable market insights to identify opportunities in existing and potential markets and assess their competitive positions within changing market scenarios.
Contact
Technavio Research
Jesse Maida
Media & Marketing Executive
US: +1 844 364 1100
UK: +44 203 893 3200
Email: media@technavio.com
Website: www.technavio.com/


SOURCE Technavio
© 2024 Benzinga.com. Benzinga does not provide investment advice. All rights reserved.
Trade confidently with insights and alerts from analyst ratings, free reports and breaking news that affects the stocks you care about.

