


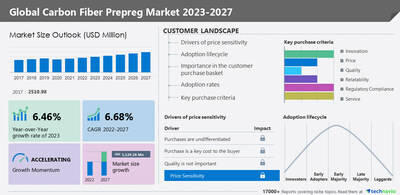
NEW YORK, March 17, 2023 /PRNewswire/ -- The global carbon fiber prepreg market size is estimated to increase by USD 1,129.26 million from 2022 to 2027. The market's growth momentum will progress at a CAGR of 6.68% during the forecast period. The growth of wind power capacities is fueling the market growth significantly. Developed regions such as North America and Western Europe account for the highest installations in wind energy across the world. The use of thermoset prepreg in the manufacturing of wind turbines is high because of its properties, namely high strength-to-weight ratio and durability. There is a rapid installation of wind energy in various countries due to stringent environmental norms of the government to control air pollution. The growing wind power capacities across various nations leverage the market during the forecast period.

Discover some insights on market size during historic period (2017 to 2021) and forecast period (2023 to 2027) before buying the full report - Request a sample report
Carbon fiber prepreg market – Segmentation Assessment
Technavio extensively covers market segmentation based on type (thermoset and thermoplastics), application (aerospace and defense, wind energy, automotive parts, and sports equipment), and geography (North America, APAC, Europe, South America, and the Middle East and Africa).
The market share growth of the thermoset segment is expected to be significant during the forecast period. The actors for the growth include favorable properties such as low processing viscosities for infusion, superior thermal resistance, and strong adhesion to carbon fibers. Some of the commonly used thermosets in wind turbine composites include epoxy and polyester. Epoxy resins have replaced polyester resins in most wind turbine applications because of their better fatigue properties and stronger and more durable blades in comparison with polyester resins.
What's New? -
- Special coverage on the Russia-Ukraine war; global inflation; recovery analysis from COVID-19; supply chain disruptions, global trade tensions; and risk of recession
- Global competitiveness and key competitor positions
- Market presence across multiple geographical footprints - Strong/Active/Niche/Trivial - Buy the report!
Geographic Overview
By geography, the global carbon fiber prepreg market is segmented into North America, APAC, Europe, South America, and the Middle East and Africa. The report provides actionable insights and estimates the contribution of all regions to the growth of the global carbon fiber prepreg market.
North America is estimated to contribute 50% to the growth of the global market during the forecast period. The main factor for the growth is the growth of the aerospace and defense industry in the region which is supported by an increase in employment and better real income. Hence, the regional market in North America is expected to grow substantially during the forecast period.
For insights on global, regional, and country-level parameters with growth opportunities from 2017 to 2027 - Download a Sample Report
Carbon fiber prepreg market – Vendor Analysis
Vendor Landscape - The global carbon fiber prepreg market is fragmented, with the presence of several global as well as regional vendors. A few prominent vendors that offer carbon fiber prepreg in the market are Axiom Materials Inc., Arvind Composites, Celanese Corp., Dexcraft, DowAksa Ileri Kompozit Malzemeler San. Ltd. Sti., Formosa M Co. Ltd., Gurit Holding AG, Hexcel Corp., K. Sakai and Co. Ltd., Kordsa Teknik Tekstil AS, Mitsubishi Chemical Corp., Nippon Steel Corp., OCSiAl, Plastic Reinforcement Fabrics Ltd., SGL Carbon SE, SK Chemicals Co. Ltd., Solvay SA, TCR Composites, Teijin Ltd., and Toray Composite Materials America Inc. and others.
Vendor Offerings -
- Celanese Corp. - The company offers business continuity management programs and a disaster recovery product line purpose-built for MSPs to efficiently prevent data loss and minimize downtime for their customers.
- Dexcraft - The company offers business continuity management programs that help the business with strategic imperatives.
- DowAksa Ileri Kompozit Malzemeler San. Ltd. Sti. - The company offers business continuity management programs that help the business to sustain potential disasters.
- For details on vendors and offerings – Request a sample report
Global Carbon Fiber Prepreg Market – Market Dynamics
Key Trends -
The growing demand for lightweight and high-performance materials is the primary trend in the market. The lightweight and high-performance materials are used in various end-user industries because of their properties, such as energy-saving and wear resistance. Lightweight and high-performance materials are widely used in the aerospace and defense, and automotive industries. Hence, the demand for carbon composites is expected to increase R&D activities, which is expected to foster the use of carbon composites in several new application areas during the forecast period.
Major challenges -
High cost related to carbon composites is a major challenge affecting the market growth. The cost of carbon fiber composites is higher than metals. It is eight times costlier when compared to steel, which restricts the market growth. The high manufacturing cost associated with carbon fiber composite is mainly because of the increased raw material cost. Hence, high raw material cost is a major challenge that may impede market growth during the forecast period.
Drivers, trends, and challenges have an impact on market dynamics, which can impact businesses. Find more insights in a sample report!
What are the key data covered in this Carbon Fiber Prepreg Market report?
- CAGR of the market during the forecast period
- Detailed information on factors that will drive the growth of the carbon fiber prepreg market between 2023 and 2027
- Precise estimation of the size of the carbon fiber prepreg market and its contribution to the market with a focus on the parent market
- Accurate predictions about upcoming trends and changes in consumer behavior
- Growth of the carbon fiber prepreg market across North America, APAC, Europe, South America, and Middle East and Africa
- A thorough analysis of the market's competitive landscape and detailed information about vendors
- Comprehensive analysis of factors that will challenge the growth of carbon fiber prepreg market vendors
Gain instant access to 17,000+ market research reports.
Technavio's SUBSCRIPTION platform
Related Reports:
The dark fiber market size is expected to increase by USD 3.94 billion from 2021 to 2026, and the market's growth momentum will accelerate at a CAGR of 11.34%. The rise in global Internet traffic is a key factor driving the global dark fiber market share growth.
The automotive carbon fiber components market size is expected to increase by 2088.81 MT from 2020 to 2025, and the market's growth momentum will accelerate at a CAGR of 5.36%. The growing use of carbon fiber materials in the automotive industry is a key driver fueling the automotive carbon fiber components market growth.
Carbon Fiber Prepreg Market Scope | |
Report Coverage | Details |
Historic period | 2017-2021 |
Forecast period | 2023-2027 |
Growth momentum & CAGR | Accelerate at a CAGR of 6.68% |
Market growth 2023-2027 | USD 1,129.26 million |
Market structure | Fragmented |
YoY growth 2022-2023 (%) | 6.46 |
Regional analysis | North America, APAC, Europe, South America, and Middle East and Africa |
Performing market contribution | North America at 50% |
Key countries | US, China, Japan, Germany, and UK, Canada, Mexico, Italy,Spain, India, Japan, Australia, and South Korea |
Competitive landscape | Leading Vendors, Market Positioning of Vendors, Competitive Strategies, and Industry Risks |
Key companies profiled | Axiom Materials Inc., Arvind Composites, Celanese Corp., Dexcraft, DowAksa Ileri Kompozit Malzemeler San. Ltd. Sti., Formosa M Co. Ltd., Gurit Holding AG, Hexcel Corp., K. Sakai and Co. Ltd., Kordsa Teknik Tekstil AS, Mitsubishi Chemical Corp., Nippon Steel Corp., OCSiAl, Plastic Reinforcement Fabrics Ltd., SGL Carbon SE, SK Chemicals Co. Ltd., Solvay SA, TCR Composites, Teijin Ltd., and Toray Composite Materials America Inc. |
Market dynamics | Parent market analysis, Market growth inducers and obstacles, Fast-growing and slow-growing segment analysis, COVID-19 impact and recovery analysis and future consumer dynamics, Market condition analysis for forecast period |
Customization purview | If our report has not included the data that you are looking for, you can reach out to our analysts and get segments customized. |
Browse for Technavio Materials market reports
Table of Contents
1 Executive Summary
- 1.1 Market overview
- Exhibit 01: Executive Summary – Chart on Market Overview
- Exhibit 02: Executive Summary – Data Table on Market Overview
- Exhibit 03: Executive Summary – Chart on Global Market Characteristics
- Exhibit 04: Executive Summary – Chart on Market by Geography
- Exhibit 05: Executive Summary – Chart on Market Segmentation by Type
- Exhibit 06: Executive Summary – Chart on Market Segmentation by Application
- Exhibit 07: Executive Summary – Chart on Incremental Growth
- Exhibit 08: Executive Summary – Data Table on Incremental Growth
- Exhibit 09: Executive Summary – Chart on Vendor Market Positioning
2 Market Landscape
- 2.1 Market ecosystem
- Exhibit 10: Parent market
- Exhibit 11: Market Characteristics
3 Market Sizing
- 3.1 Market definition
- Exhibit 12: Offerings of vendors included in the market definition
- 3.2 Market segment analysis
- Exhibit 13: Market segments
- 3.3 Market size 2022
- 3.4 Market outlook: Forecast for 2022-2027
- Exhibit 14: Chart on Global - Market size and forecast 2022-2027 ($ million)
- Exhibit 15: Data Table on Global - Market size and forecast 2022-2027 ($ million)
- Exhibit 16: Chart on Global Market: Year-over-year growth 2022-2027 (%)
- Exhibit 17: Data Table on Global Market: Year-over-year growth 2022-2027 (%)
4 Historic Market Size
- 4.1 Global carbon fiber prepreg market 2017 - 2021
- Exhibit 18: Historic Market Size – Data Table on Global carbon fiber prepreg market 2017 - 2021 ($ million)
- 4.2 Type Segment Analysis 2017 - 2021
- Exhibit 19: Historic Market Size – Type Segment 2017 - 2021 ($ million)
- 4.3 Application Segment Analysis 2017 - 2021
- Exhibit 20: Historic Market Size – Application Segment 2017 - 2021 ($ million)
- 4.4 Geography Segment Analysis 2017 - 2021
- Exhibit 21: Historic Market Size – Geography Segment 2017 - 2021 ($ million)
- 4.5 Country Segment Analysis 2017 - 2021
- Exhibit 22: Historic Market Size – Country Segment 2017 - 2021 ($ million)
5 Five Forces Analysis
- 5.1 Five forces summary
- Exhibit 23: Five forces analysis - Comparison between 2022 and 2027
- 5.2 Bargaining power of buyers
- Exhibit 24: Chart on Bargaining power of buyers – Impact of key factors 2022 and 2027
- 5.3 Bargaining power of suppliers
- Exhibit 25: Bargaining power of suppliers – Impact of key factors in 2022 and 2027
- 5.4 Threat of new entrants
- Exhibit 26: Threat of new entrants – Impact of key factors in 2022 and 2027
- 5.5 Threat of substitutes
- Exhibit 27: Threat of substitutes – Impact of key factors in 2022 and 2027
- 5.6 Threat of rivalry
- Exhibit 28: Threat of rivalry – Impact of key factors in 2022 and 2027
- 5.7 Market condition
- Exhibit 29: Chart on Market condition - Five forces 2022 and 2027
6 Market Segmentation by Type
- 6.1 Market segments
- Exhibit 30: Chart on Type - Market share 2022-2027 (%)
- Exhibit 31: Data Table on Type - Market share 2022-2027 (%)
- 6.2 Comparison by Type
- Exhibit 32: Chart on Comparison by Type
- Exhibit 33: Data Table on Comparison by Type
- 6.3 Thermoset - Market size and forecast 2022-2027
- Exhibit 34: Chart on Thermoset - Market size and forecast 2022-2027 ($ million)
- Exhibit 35: Data Table on Thermoset - Market size and forecast 2022-2027 ($ million)
- Exhibit 36: Chart on Thermoset - Year-over-year growth 2022-2027 (%)
- Exhibit 37: Data Table on Thermoset - Year-over-year growth 2022-2027 (%)
- 6.4 Thermoplastics - Market size and forecast 2022-2027
- Exhibit 38: Chart on Thermoplastics - Market size and forecast 2022-2027 ($ million)
- Exhibit 39: Data Table on Thermoplastics - Market size and forecast 2022-2027 ($ million)
- Exhibit 40: Chart on Thermoplastics - Year-over-year growth 2022-2027 (%)
- Exhibit 41: Data Table on Thermoplastics - Year-over-year growth 2022-2027 (%)
- 6.5 Market opportunity by Type
- Exhibit 42: Market opportunity by Type ($ million)
7 Market Segmentation by Application
- 7.1 Market segments
- Exhibit 43: Chart on Application - Market share 2022-2027 (%)
- Exhibit 44: Data Table on Application - Market share 2022-2027 (%)
- 7.2 Comparison by Application
- Exhibit 45: Chart on Comparison by Application
- Exhibit 46: Data Table on Comparison by Application
- 7.3 Aerospace and defense - Market size and forecast 2022-2027
- Exhibit 47: Chart on Aerospace and defense - Market size and forecast 2022-2027 ($ million)
- Exhibit 48: Data Table on Aerospace and defense - Market size and forecast 2022-2027 ($ million)
- Exhibit 49: Chart on Aerospace and defense - Year-over-year growth 2022-2027 (%)
- Exhibit 50: Data Table on Aerospace and defense - Year-over-year growth 2022-2027 (%)
- 7.4 Wind energy - Market size and forecast 2022-2027
- Exhibit 51: Chart on Wind energy - Market size and forecast 2022-2027 ($ million)
- Exhibit 52: Data Table on Wind energy - Market size and forecast 2022-2027 ($ million)
- Exhibit 53: Chart on Wind energy - Year-over-year growth 2022-2027 (%)
- Exhibit 54: Data Table on Wind energy - Year-over-year growth 2022-2027 (%)
- 7.5 Automotive parts - Market size and forecast 2022-2027
- Exhibit 55: Chart on Automotive parts - Market size and forecast 2022-2027 ($ million)
- Exhibit 56: Data Table on Automotive parts - Market size and forecast 2022-2027 ($ million)
- Exhibit 57: Chart on Automotive parts - Year-over-year growth 2022-2027 (%)
- Exhibit 58: Data Table on Automotive parts - Year-over-year growth 2022-2027 (%)
- 7.6 Sports equipment - Market size and forecast 2022-2027
- Exhibit 59: Chart on Sports equipment - Market size and forecast 2022-2027 ($ million)
- Exhibit 60: Data Table on Sports equipment - Market size and forecast 2022-2027 ($ million)
- Exhibit 61: Chart on Sports equipment - Year-over-year growth 2022-2027 (%)
- Exhibit 62: Data Table on Sports equipment - Year-over-year growth 2022-2027 (%)
- 7.7 Market opportunity by Application
- Exhibit 63: Market opportunity by Application ($ million)
8 Customer Landscape
- 8.1 Customer landscape overview
- Exhibit 64: Analysis of price sensitivity, lifecycle, customer purchase basket, adoption rates, and purchase criteria
9 Geographic Landscape
- 9.1 Geographic segmentation
- Exhibit 65: Chart on Market share by geography 2022-2027 (%)
- Exhibit 66: Data Table on Market share by geography 2022-2027 (%)
- 9.2 Geographic comparison
- Exhibit 67: Chart on Geographic comparison
- Exhibit 68: Data Table on Geographic comparison
- 9.3 North America - Market size and forecast 2022-2027
- Exhibit 69: Chart on North America - Market size and forecast 2022-2027 ($ million)
- Exhibit 70: Data Table on North America - Market size and forecast 2022-2027 ($ million)
- Exhibit 71: Chart on North America - Year-over-year growth 2022-2027 (%)
- Exhibit 72: Data Table on North America - Year-over-year growth 2022-2027 (%)
- 9.4 APAC - Market size and forecast 2022-2027
- Exhibit 73: Chart on APAC - Market size and forecast 2022-2027 ($ million)
- Exhibit 74: Data Table on APAC - Market size and forecast 2022-2027 ($ million)
- Exhibit 75: Chart on APAC - Year-over-year growth 2022-2027 (%)
- Exhibit 76: Data Table on APAC - Year-over-year growth 2022-2027 (%)
- 9.5 Europe - Market size and forecast 2022-2027
- Exhibit 77: Chart on Europe - Market size and forecast 2022-2027 ($ million)
- Exhibit 78: Data Table on Europe - Market size and forecast 2022-2027 ($ million)
- Exhibit 79: Chart on Europe - Year-over-year growth 2022-2027 (%)
- Exhibit 80: Data Table on Europe - Year-over-year growth 2022-2027 (%)
- 9.6 South America - Market size and forecast 2022-2027
- Exhibit 81: Chart on South America - Market size and forecast 2022-2027 ($ million)
- Exhibit 82: Data Table on South America - Market size and forecast 2022-2027 ($ million)
- Exhibit 83: Chart on South America - Year-over-year growth 2022-2027 (%)
- Exhibit 84: Data Table on South America - Year-over-year growth 2022-2027 (%)
- 9.7 Middle East and Africa - Market size and forecast 2022-2027
- Exhibit 85: Chart on Middle East and Africa - Market size and forecast 2022-2027 ($ million)
- Exhibit 86: Data Table on Middle East and Africa - Market size and forecast 2022-2027 ($ million)
- Exhibit 87: Chart on Middle East and Africa - Year-over-year growth 2022-2027 (%)
- Exhibit 88: Data Table on Middle East and Africa - Year-over-year growth 2022-2027 (%)
- 9.8 US - Market size and forecast 2022-2027
- Exhibit 89: Chart on US - Market size and forecast 2022-2027 ($ million)
- Exhibit 90: Data Table on US - Market size and forecast 2022-2027 ($ million)
- Exhibit 91: Chart on US - Year-over-year growth 2022-2027 (%)
- Exhibit 92: Data Table on US - Year-over-year growth 2022-2027 (%)
- 9.9 China - Market size and forecast 2022-2027
- Exhibit 93: Chart on China - Market size and forecast 2022-2027 ($ million)
- Exhibit 94: Data Table on China - Market size and forecast 2022-2027 ($ million)
- Exhibit 95: Chart on China - Year-over-year growth 2022-2027 (%)
- Exhibit 96: Data Table on China - Year-over-year growth 2022-2027 (%)
- 9.10 Japan - Market size and forecast 2022-2027
- Exhibit 97: Chart on Japan - Market size and forecast 2022-2027 ($ million)
- Exhibit 98: Data Table on Japan - Market size and forecast 2022-2027 ($ million)
- Exhibit 99: Chart on Japan - Year-over-year growth 2022-2027 (%)
- Exhibit 100: Data Table on Japan - Year-over-year growth 2022-2027 (%)
- 9.11 Germany - Market size and forecast 2022-2027
- Exhibit 101: Chart on Germany - Market size and forecast 2022-2027 ($ million)
- Exhibit 102: Data Table on Germany - Market size and forecast 2022-2027 ($ million)
- Exhibit 103: Chart on Germany - Year-over-year growth 2022-2027 (%)
- Exhibit 104: Data Table on Germany - Year-over-year growth 2022-2027 (%)
- 9.12 UK - Market size and forecast 2022-2027
- Exhibit 105: Chart on UK - Market size and forecast 2022-2027 ($ million)
- Exhibit 106: Data Table on UK - Market size and forecast 2022-2027 ($ million)
- Exhibit 107: Chart on UK - Year-over-year growth 2022-2027 (%)
- Exhibit 108: Data Table on UK - Year-over-year growth 2022-2027 (%)
- 9.13 Market opportunity by geography
- Exhibit 109: Market opportunity by geography ($ million)
10 Drivers, Challenges, and Trends
- 10.1 Market drivers
- 10.2 Market challenges
- 10.3 Impact of drivers and challenges
- Exhibit 110: Impact of drivers and challenges in 2022 and 2027
- 10.4 Market trends
11 Vendor Landscape
- 11.1 Overview
- 11.2 Vendor landscape
- Exhibit 111: Overview on Criticality of inputs and Factors of differentiation
- 11.3 Landscape disruption
- Exhibit 112: Overview on factors of disruption
- 11.4 Industry risks
- Exhibit 113: Impact of key risks on business
12 Vendor Analysis
- 12.1 Vendors covered
- Exhibit 114: Vendors covered
- 12.2 Market positioning of vendors
- Exhibit 115: Matrix on vendor position and classification
- 12.3 Axiom Materials Inc.
- Exhibit 116: Axiom Materials Inc. - Overview
- Exhibit 117: Axiom Materials Inc. - Product / Service
- Exhibit 118: Axiom Materials Inc. - Key offerings
- 12.4 Arvind Composites
- Exhibit 119: Arvind Composites - Overview
- Exhibit 120: Arvind Composites - Product / Service
- Exhibit 121: Arvind Composites - Key offerings
- 12.5 Celanese Corp.
- Exhibit 122: Celanese Corp. - Overview
- Exhibit 123: Celanese Corp. - Business segments
- Exhibit 124: Celanese Corp. - Key offerings
- Exhibit 125: Celanese Corp. - Segment focus
- 12.6 Formosa M Co. Ltd.
- Exhibit 126: Formosa M Co. Ltd. - Overview
- Exhibit 127: Formosa M Co. Ltd. - Product / Service
- Exhibit 128: Formosa M Co. Ltd. - Key offerings
- 12.7 Gurit Holding AG
- Exhibit 129: Gurit Holding AG - Overview
- Exhibit 130: Gurit Holding AG - Business segments
- Exhibit 131: Gurit Holding AG - Key offerings
- Exhibit 132: Gurit Holding AG - Segment focus
- 12.8 Hexcel Corp.
- Exhibit 133: Hexcel Corp. - Overview
- Exhibit 134: Hexcel Corp. - Business segments
- Exhibit 135: Hexcel Corp. - Key news
- Exhibit 136: Hexcel Corp. - Key offerings
- Exhibit 137: Hexcel Corp. - Segment focus
- 12.9 Kordsa Teknik Tekstil AS
- Exhibit 138: Kordsa Teknik Tekstil AS - Overview
- Exhibit 139: Kordsa Teknik Tekstil AS - Business segments
- Exhibit 140: Kordsa Teknik Tekstil AS - Key news
- Exhibit 141: Kordsa Teknik Tekstil AS - Key offerings
- Exhibit 142: Kordsa Teknik Tekstil AS - Segment focus
- 12.10 Mitsubishi Chemical Corp.
- Exhibit 143: Mitsubishi Chemical Corp. - Overview
- Exhibit 144: Mitsubishi Chemical Corp. - Business segments
- Exhibit 145: Mitsubishi Chemical Corp. - Key news
- Exhibit 146: Mitsubishi Chemical Corp. - Key offerings
- Exhibit 147: Mitsubishi Chemical Corp. - Segment focus
- 12.11 Nippon Steel Corp.
- Exhibit 148: Nippon Steel Corp. - Overview
- Exhibit 149: Nippon Steel Corp. - Business segments
- Exhibit 150: Nippon Steel Corp. - Key offerings
- Exhibit 151: Nippon Steel Corp. - Segment focus
- 12.12 OCSiAl
- Exhibit 152: OCSiAl - Overview
- Exhibit 153: OCSiAl - Product / Service
- Exhibit 154: OCSiAl - Key offerings
- 12.13 Plastic Reinforcement Fabrics Ltd.
- Exhibit 155: Plastic Reinforcement Fabrics Ltd. - Overview
- Exhibit 156: Plastic Reinforcement Fabrics Ltd. - Product / Service
- Exhibit 157: Plastic Reinforcement Fabrics Ltd. - Key offerings
- 12.14 SGL Carbon SE
- Exhibit 158: SGL Carbon SE - Overview
- Exhibit 159: SGL Carbon SE - Business segments
- Exhibit 160: SGL Carbon SE - Key news
- Exhibit 161: SGL Carbon SE - Key offerings
- Exhibit 162: SGL Carbon SE - Segment focus
- 12.15 Solvay SA
- Exhibit 163: Solvay SA - Overview
- Exhibit 164: Solvay SA - Business segments
- Exhibit 165: Solvay SA - Key news
- Exhibit 166: Solvay SA - Key offerings
- Exhibit 167: Solvay SA - Segment focus
- 12.16 Teijin Ltd.
- Exhibit 168: Teijin Ltd. - Overview
- Exhibit 169: Teijin Ltd. - Business segments
- Exhibit 170: Teijin Ltd. - Key offerings
- Exhibit 171: Teijin Ltd. - Segment focus
- 12.17 Toray Composite Materials America Inc.
- Exhibit 172: Toray Composite Materials America Inc. - Overview
- Exhibit 173: Toray Composite Materials America Inc. - Product / Service
- Exhibit 174: Toray Composite Materials America Inc. - Key offerings
13 Appendix
- 13.1 Scope of the report
- 13.2 Inclusions and exclusions checklist
- Exhibit 175: Inclusions checklist
- Exhibit 176: Exclusions checklist
- 13.3 Currency conversion rates for US$
- Exhibit 177: Currency conversion rates for US$
- 13.4 Research methodology
- Exhibit 178: Research methodology
- Exhibit 179: Validation techniques employed for market sizing
- Exhibit 180: Information sources
- 13.5 List of abbreviations
- Exhibit 181: List of abbreviations
About Us
Technavio is a leading global technology research and advisory company. Their research and analysis focuses on emerging market trends and provides actionable insights to help businesses identify market opportunities and develop effective strategies to optimize their market positions. With over 500 specialized analysts, Technavio's report library consists of more than 17,000 reports and counting, covering 800 technologies, spanning across 50 countries. Their client base consists of enterprises of all sizes, including more than 100 Fortune 500 companies. This growing client base relies on Technavio's comprehensive coverage, extensive research, and actionable market insights to identify opportunities in existing and potential markets and assess their competitive positions within changing market scenarios.
Contact
Technavio Research
Jesse Maida
Media & Marketing Executive
US: +1 844 364 1100
UK: +44 203 893 3200
Email: media@technavio.com
Website: www.technavio.com/


SOURCE Technavio
© 2024 Benzinga.com. Benzinga does not provide investment advice. All rights reserved.
Trade confidently with insights and alerts from analyst ratings, free reports and breaking news that affects the stocks you care about.

