


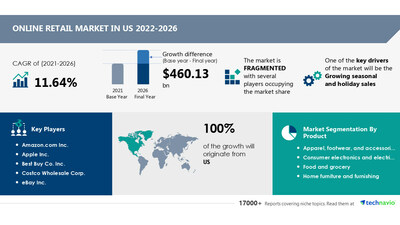
NEW YORK, March 14, 2023 /PRNewswire/ -- The online retail market in the US size is estimated to grow by USD 460.13 billion from 2021 to 2026, according to Technavio. The market is estimated to grow at a CAGR of 11.64% during the forecast period. The growing seasonal and holiday sales are driving the online retail market growth in the US significantly. Omnichannel retailing is one of the major trends shaping the market.

For more insights on the forecast market size (2021 to 2026) - Request a sample report
What's New?
- Recovery analysis from COVID-19; supply chain disruptions, global trade tensions; and risk of recession
- Global competitiveness and key competitor positions
- Market presence across multiple geographical footprints - Strong/Active/Niche/Trivial - buy the report!
Online Retail Market in the US - Segmentation Assessment
Segment Overview
Technavio has segmented the market based on the product (apparel, footwear, and accessories, consumer electronics and electricals, food, and grocery, home furniture and furnishing, and others) and device (smartphones and tablets and PCs).
- The market share growth by the apparel, footwear, and accessories segment will be significant during the forecast period. The market growth can be attributed to factors such as the availability of simple and secure online payment options, the ability to track shipments, 24/7 customer service, and low prices. As apparel, footwear, and accessories are products with a low perceived risk of product delivery and returns, they have gained popularity on the internet. Furthermore, the growing population and rising disposable personal income are two significant drivers shaping the segment growth in the online retail market in the US.
Insights on the market contribution of various segments including country and region wise, and forecast market size (2021 to 2026) - Download a Sample Report
Online Retail Market in the US – Market Dynamics
Key factor driving market growth
- One of the key drivers shaping the growth of the online retail market in the US is holiday and seasonal sales.
- For instance, e-commerce sales in the US, increased by 11% in 2021 from November 1 to December 24, compared to a massive 47.2% growth in the holiday season of 2020.
- Generally, sales increase during Thanksgiving, Black Friday, and Cyber Monday.
- The largest gaining product categories during the holiday season include apparel, footwear and accessories, consumer electronics, computer hardware, and toys.
- The US consumers spent USD 204.5 billion online in November and December 2021, up 8.6% over the same period in 2020. In conclusion, exciting sales and offers are driving the online retail market growth during the forecast period.
Leading trends influencing the market
- Omni-channel marketing is a major trend in the online retail market in the US that drives market growth during the forecast period. Omni-channel marketing is rapidly becoming the norm for many retailers in the country.
- This marketing strategy allows consumers the option to shop online and pick up the merchandise from the store nearest to their location on the same day.
- Retailers are experiencing a high influence through their online presence on their in-store sales. One such example is Best Buy integrating its offline and online stores to boost revenues.
- The retailer is utilizing physical stores as distribution centers for online purchases as a part of the omnichannel strategy. According to Best Buy, 40% of its online shoppers prefer to pick up their purchases from physical stores. The company also challenges online and discount retailers with its match-to-price strategy, claiming to offer gadgets at or lower than the price offered by its competitors.
- Thus, marketing strategies like omnichannel marketing are expected to drive market growth during the forecast period.
Major challenges hindering the market growth
- Some of the factors hindering the US online retail market growth include transportation and logistics.
- The three major processes where the intervention of transportation and logistics come into the picture are product procurement, shipping the ordered items, and delivery to the customers. All these processes require a high time and money investment, challenging the efficiency and effectiveness of retailers and their costing strategies.
- The profit margin of retailers is reduced due to the higher cost incurred from transportation and logistics. Most of the time, retailers are unable to break even.
- Transportation and logistics will continue to be under a lot of pressure owing to rising fuel prices, driver shortages, as well as a governmental and societal push for increased digitization and sustainability.
Insights on market drivers, trends, & challenges, and forecast period(2021 to 2026)- Request a sample report!
What are the key data covered in this Online Retail Market in the US report?
- CAGR of the market during the forecast period
- Detailed information on factors that will drive the growth of the online retail market in the US between 2022 and 2026
- Precise estimation of the size of the online retail market in the US size and its contribution to the market with a focus on the parent market
- Accurate predictions about upcoming trends and changes in consumer behavior
- Growth of the online retail market across the US
- A thorough analysis of the market's competitive landscape and detailed information about vendors
- Comprehensive analysis of factors that will challenge the growth in the online retail market in the US vendors
Gain instant access to 17,000+ market research reports.
Technavio's SUBSCRIPTION platform
Related Reports:
The online toys and games retailing market size is expected to increase by USD 16.04 billion from 2021 to 2026, and the market's growth momentum will accelerate at a CAGR of 6.39%. In-sync mobile and traditional games is a major driver impacting the online toys and games retailing market growth.
The online baby products retailing market size is expected to increase by USD 13.61 billion from 2021 to 2026, and the market's growth momentum will accelerate at a CAGR of 9.82%. A key factor driving growth in the online baby products retailing market is the easier payment options.
Online Retail Market in the US Scope | |
Report Coverage | Details |
Base year | 2021 |
Historic period | 2017-2021 |
Forecast period | 2022-2026 |
Growth momentum & CAGR | Accelerate at a CAGR of 11.64% |
Market growth 2022-2026 | USD 460.13 billion |
Market structure | Fragmented |
YoY growth 2022-2023 (%) | 10.97 |
Regional analysis | US |
Competitive landscape | Leading Vendors, Market Positioning of Vendors, Competitive Strategies, and Industry Risks |
Key companies profiled | Amazon.com Inc., Apple Inc., Best Buy Co. Inc., Costco Wholesale Corp., eBay Inc., Kroger Co., Target Corp., The Home Depot Inc., Walmart Inc., and Wayfair Inc. |
Market dynamics | Parent market analysis, Market growth inducers and obstacles, Fast-growing and slow-growing segment analysis, COVID-19 impact and recovery analysis and future consumer dynamics, Market condition analysis for forecast period |
Customization purview | If our report has not included the data that you are looking for, you can reach out to our analysts and get segments customized. |
Browse for Technavio Consumer Discretionary market reports
Table of Contents
1. Executive Summary
1.1 Market Overview
Exhibit 01: Key Finding 1
Exhibit 02: Key Finding 2
Exhibit 03: Key Finding 5
Exhibit 04: Key Finding 6
Exhibit 05: Key Finding 7
2. Market Landscape
2.1 Market ecosystem
2.1.1 Parent Market
Exhibit 06 Parent market
Exhibit 07: Market characteristics
2.2 Value Chain Analysis
Exhibit 08: Value chain analysis : Internet and Direct Marketing Retail Market
2.2.1 Inputs
2.2.2 Inbound logistics
2.2.3 Operations
2.2.4 Outbound logistics
2.2.5 Marketing and sales
2.2.6 Service
2.2.7 Support activities
2.2.8 Innovation
3. Market Sizing
3.1 Market definition
Exhibit 09: Offerings of vendors included in the market definition
3.2 Market segment analysis
Exhibit 10: Market segments
3.3 Market size 2021
3.4 Market outlook: Forecast for 2021 - 2026
3.4.1 Estimating growth rates for emerging and high-growth markets
3.4.2 Estimating growth rates for mature markets
Exhibit 11: US - Market size and forecast 2021 - 2026 ($ billion)
Exhibit 12: US market: Year-over-year growth 2021 - 2026 (%)
4. Five Forces Analysis
4.1 Five Forces Summary
Exhibit 13: Five forces analysis 2021 - 2026
4.2 Bargaining power of buyers
Exhibit 14: Bargaining power of the buyer
4.3 Bargaining power of suppliers
Exhibit 15: Bargaining power of the supplier
4.4 Threat of new entrants
Exhibit 16: Threat of new entrants
4.5 Threat of substitutes
Exhibit 17: Threat of substitutes
4.6 Threat of rivalry
Exhibit 18: Threat of rivalry
4.7 Market condition
Exhibit 19: Market condition - Five forces 2021
5. Market Segmentation by Product
5.1 Market segments
The segments covered in this chapter are:
- Apparel, footwear, and accessories
- Consumer electronics and electricals
- Food and grocery
- Home furniture and furnishing
- Others
Exhibit 20: Product - Market share 2021-2026 (%)
5.2 Comparison by Product
Exhibit 21: Comparison by Product
5.3 Apparel, footwear, and accessories - Market size and forecast 2021-2026
Exhibit 22: Apparel, footwear, and accessories - Market size and forecast 2021-2026 ($ billion)
Exhibit 23: Apparel, footwear, and accessories - Year-over-year growth 2021-2026 (%)
5.4 Consumer electronics and electricals - Market size and forecast 2021-2026
Exhibit 24: Consumer electronics and electricals - Market size and forecast 2021-2026 ($ billion)
Exhibit 25: Consumer electronics and electricals - Year-over-year growth 2021-2026 (%)
5.5 Food and grocery - Market size and forecast 2021-2026
Exhibit 26: Food and grocery - Market size and forecast 2021-2026 ($ billion)
Exhibit 27: Food and grocery - Year-over-year growth 2021-2026 (%)
5.6 Home furniture and furnishing - Market size and forecast 2021-2026
Exhibit 28: Home furniture and furnishing - Market size and forecast 2021-2026 ($ billion)
Exhibit 29: Home furniture and furnishing - Year-over-year growth 2021-2026 (%)
5.7 Others - Market size and forecast 2021-2026
Exhibit 30: Others - Market size and forecast 2021-2026 ($ million)
Exhibit 31: Others - Year-over-year growth 2021-2026 (%)
5.8 Market opportunity by Product
Exhibit 32: Market opportunity by Product
6 Market Segmentation by Device
6.1 Market segments
The segments covered in this chapter are:
- Smartphones and tablets
- PCs
Exhibit 33: Device - Market share 2021-2026 (%)
6.2 Comparison by Device
Exhibit 34: Comparison by Device
6.3 Smartphones and tablets - Market size and forecast 2021-2026
Exhibit 35: Smartphones and tablets - Market size and forecast 2021-2026 ($ billion)
Exhibit 36: Smartphones and tablets - Year-over-year growth 2021-2026 (%)
6.4 PCs - Market size and forecast 2021-2026
Exhibit 37: PCs - Market size and forecast 2021-2026 ($ billion)
Exhibit 38: PCs - Year-over-year growth 2021-2026 (%)
6.5 Market opportunity by Device
Exhibit 39: Market opportunity by Device
7. Customer landscape
Technavio's customer landscape matrix comparing Drivers or price sensitivity, Adoption lifecycle, importance in customer price basket, Adoption rate and Key purchase criteria
7.1 Overview
Exhibit 40: Customer landscape
8. Drivers, Challenges, and Trends
8.1 Market drivers
8.1.1 Growing seasonal and holiday sales
8.1.2 High penetration of Internet and smartphones and rising online spending
8.1.3 Increase in time poverty and easy payment options
8.2 Market challenges
8.2.1 Transportation and logistics
8.2.2 Poor technology integration, especially with online specialty retailers operating at small scales
8.2.3 High preference for shopping most product categories in physical stores
Exhibit 41: Impact of drivers and challenges
8.3 Market trends
8.3.1 Omni-channel retailing
8.3.2 Social media marketing
8.3.3 Rising popularity of digital payment services
9. Vendor Landscape
9.1 Overview
Exhibit 42: Vendor landscape
9.2 Landscape disruption
Exhibit 43: Landscape disruption
Exhibit 44: Industry Risk
9.3 Competitive scenario
10. Vendor Analysis
10.1 Vendors covered
Exhibit 45: Vendors covered
10.2 Market positioning of vendors
Exhibit 46: ?Market positioning of vendors?
10.3 Amazon.com Inc.
Exhibit 47: Amazon.com Inc. - Overview
Exhibit 48: Amazon.com Inc. - Business segments
Exhibit 49: Amazon.com Inc. - Key news
Exhibit 50: Amazon.com Inc. - Key offerings
Exhibit 51: Amazon.com Inc. - Segment focus
Exhibit 51: Amazon.com Inc. - Segment focus
Exhibit 52: Apple Inc. - Overview
Exhibit 53: Apple Inc. - Business segments
Exhibit 54: Apple Inc. - Key news
Exhibit 55: Apple Inc. - Key offerings
Exhibit 56: Apple Inc. - Segment focus
10.4 Best Buy Co. Inc.
Exhibit 57: Best Buy Co. Inc. - Overview
Exhibit 58: Best Buy Co. Inc. - Business segments
Exhibit 59: Best Buy Co. Inc. - Key offerings
Exhibit 60: Best Buy Co. Inc. - Segment focus
10.5 Costco Wholesale Corp.
Exhibit 61: Costco Wholesale Corp. - Overview
Exhibit 62: Costco Wholesale Corp. - Business segments
Exhibit 63: Costco Wholesale Corp. - Key offerings
Exhibit 64: Costco Wholesale Corp. - Segment focus
10.6 eBay Inc.
Exhibit 65: eBay Inc. - Overview
Exhibit 66: eBay Inc. - Product and service
Exhibit 67: eBay Inc. - Key offerings
10.7 Kroger Co.
Exhibit 68: Kroger Co. - Overview
Exhibit 69: Kroger Co. - Product and service
Exhibit 70: Kroger Co. - Key offerings
10.8 Target Corp.
Exhibit 71: Target Corp. - Overview
Exhibit 72: Target Corp. - Product and service
Exhibit 73: Target Corp. - Key news
Exhibit 74: Target Corp. - Key offerings
10.9 The Home Depot Inc.
Exhibit 75: The Home Depot Inc. - Overview
Exhibit 76: The Home Depot Inc. - Product and service
Exhibit 77: The Home Depot Inc. - Key news
Exhibit 78: The Home Depot Inc. - Key offerings
10.10 Walmart Inc.
Exhibit 79: Walmart Inc. - Overview
Exhibit 80: Walmart Inc. - Business segments
Exhibit 81: Walmart Inc. - Key offerings
Exhibit 82: Walmart Inc. - Segment focus
10.11 Wayfair Inc.
Exhibit 83: Wayfair Inc. - Overview
Exhibit 84: Wayfair Inc. - Business segments
Exhibit 85: Wayfair Inc. - Key news
Exhibit 86: Wayfair Inc. - Key offerings
Exhibit 87: Wayfair Inc. - Segment focus
11. Appendix
11.1 Scope of the report
11.1.1 Market definition
11.1.2 Objectives
11.1.3 Notes and caveats
11.2 Currency conversion rates for US$
Exhibit 88: Currency conversion rates for US$
11.3 Research methodology
Exhibit 89: Research Methodology
Exhibit 90: Validation techniques employed for market sizing
Exhibit 91: ??Information sources
11.4 List of abbreviations
Exhibit 92: List of abbreviations
About Us
Technavio is a leading global technology research and advisory company. Their research and analysis focuses on emerging market trends and provides actionable insights to help businesses identify market opportunities and develop effective strategies to optimize their market positions. With over 500 specialized analysts, Technavio's report library consists of more than 17,000 reports and counting, covering 800 technologies, spanning across 50 countries. Their client base consists of enterprises of all sizes, including more than 100 Fortune 500 companies. This growing client base relies on Technavio's comprehensive coverage, extensive research, and actionable market insights to identify opportunities in existing and potential markets and assess their competitive positions within changing market scenarios.
Contact
Technavio Research
Jesse Maida
Media & Marketing Executive
US: +1 844 364 1100
UK: +44 203 893 3200
Email: media@technavio.com
Website: www.technavio.com/


SOURCE Technavio
© 2024 Benzinga.com. Benzinga does not provide investment advice. All rights reserved.
Trade confidently with insights and alerts from analyst ratings, free reports and breaking news that affects the stocks you care about.

