


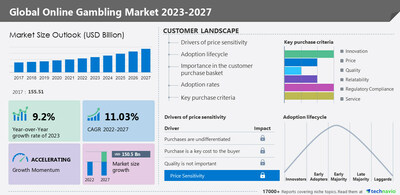
NEW YORK, March 6, 2023 /PRNewswire/ -- According to Technavio, the global online gambling market size is estimated to grow by USD 150.5 billion from 2022 to 2027. The market is estimated to grow at a CAGR of 11.03% during the forecast period. The growing demand for mobile gaming is notably driving the market growth. Smartphone penetration is increasing due to the declining average selling price (ASP) of the devices. Smartphones provide a convenient and intuitive interface to play casino games, which is resulting in users migrating from desktops to mobiles to play. This factor, coupled with the easier payment options made smartphones a major platform for online gambling vendors. Hence, it is expected that the growing smartphone penetration will provide various opportunities for online gambling vendors to capture increased market shares during the forecast period.

For more insights on the historic (2017 to 2021) and forecast market size (2023 to 2027) - Request a sample report
Leading trends influencing the market
- There is a rapid adoption of AI in the field of online gambling. While offline players use AI to analyze the risk appetite behavior of users and predict winners and losers during a casino game, online players use it to improve user experience.
- Some of the uses of AI in land-based casino operations include the optimization of marketing campaigns by MGM Resorts International and Caesars Entertainment. This AI-based solution was provided by Mobius Solutions Ltd. (Mobius Solutions).
- Thus, the trend of usage of AI is expected to maximize profits for the online gambling market during the forecast period.
Major challenges hindering the market growth
- The elevated data security issues are a major challenge that may impede the growth of the market.
- Security and credibility issues in online gambling platforms are major hindrances to market growth. This is because most websites do not have a proper dispute resolution framework and lack transparency in cash prize payouts.
- They lack fair and responsible casino gambling standards, which discourages new users from joining gambling games.
- This is coupled with the factor that online gambling websites have become the prime target for scammers and cyber-attacks may impede the growth of the market during the forecast period.
Insights on Market Drivers, trends, & Challenges, historic period (2017 to 2021) and forecast period (2023 to 2027)- Request a sample report!
What's New?
- Special coverage on the Russia-Ukraine war; global inflation; recovery analysis from COVID-19; supply chain disruptions, global trade tensions; and risk of recession
- Global competitiveness and key competitor positions
- Market presence across multiple geographical footprints - Strong/Active/Niche/Trivial - buy the report!
Online Gambling Market - Segmentation Assessment
Segment Overview
Technavio has segmented the market based on device (desktop and mobile), product (lottery, betting, and casino), and geography (North America, APAC, Europe, South America, and Middle East and Africa).
- The desktop segment is estimated to be a major contributor to the global online gambling market during the forecast period.
- The bigger display screens and better experience are the factors driving the growth in the segment. However, this segment is expected to have stagnant growth during the forecast period due to users switching to mobile devices for their convenience.
- Most online gambling vendors provide options for both web-based offerings, which offer a better experience on a desktop, and a mobile-based solution for users who prefer smartphones.
- This segment is expected to be affected adversely during the forecast period due to the increasing size of the mobile screen display.
Geography Overview
By geography, the global online gambling market is segmented into North America, APAC, Europe, South America, and Middle East and Africa. The report provides actionable insights and estimates the contribution of all regions to the growth of the global online gambling market.
- APAC is estimated to contribute to 39% of the market growth during the forecast period. Another region offering significant growth opportunities is North America.
- The US is the key leading country in the online gambling market in the North American region. This is due to the increasing adoption of online-based gambling games like poker, bingo, and lottery.
- The increasing usage of mobile applications and websites for online gambling has enabled vendors to launch various options for users.
- For instance, the company, Lotto.com Inc. in 2021, announced the launch of its first digital platform in New Jersey to purchase lottery tickets online without the need for an app or pre-deposited amounts.
Insights on the market contribution of various segments including country and region wise, historic (2017 to 2021) and forecast market size (2023 to 2027) - Download a Sample Report
What are the key data covered in this Online Gambling Market report?
- CAGR of the market during the forecast period
- Detailed information on factors that will drive the growth of the Online Gambling Market between 2023 and 2027
- Precise estimation of the size of the Online Gambling Market size and its contribution to the market in focus on the parent market
- Accurate predictions about upcoming trends and changes in consumer behavior
- Growth of the Online Gambling Market industry across North America, APAC, Europe, South America, and Middle East and Africa
- A thorough analysis of the market's competitive landscape and detailed information about vendors
- Comprehensive analysis of factors that will challenge the growth of Online Gambling Market vendors
Gain instant access to 17,000+ market research reports.
Technavio's SUBSCRIPTION platform
Related Reports:
The gambling market size in the UK is expected to increase by USD 2.83 billion from 2021 to 2026, at a CAGR of 5.25%. One of the key factors driving the UK gambling market growth is the growth of the online gambling market.
The virtual reality (VR) gambling market size is expected to increase by USD 1.74 billion from 2020 to 2025, and the market's growth momentum will accelerate at a CAGR of 53.13%. The increased adoption of online gaming platforms has boosted the VR gambling market.
Online Gambling Market Scope | |
Report Coverage | Details |
Base year | 2022 |
Historic period | 2017-2021 |
Forecast period | 2023-2027 |
Growth momentum & CAGR | Accelerate at a CAGR of 11.03% |
Market growth 2023-2027 | USD150.5 billion |
Market structure | Fragmented |
YoY growth 2022-2023 (%) | 9.2 |
Regional analysis | North America, APAC, Europe, South America, and Middle East and Africa |
Performing market contribution | APAC at 39% |
Key countries | US, Canada, China, UK, Germany, Canada, Mexico, Italy, Spain, India, Japan, Australia, and South Korea |
Competitive landscape | Leading Vendors, Market Positioning of Vendors, Competitive Strategies, and Industry Risks |
Key companies profiled | 888 Holdings Plc, Bet365 Group Ltd., BetOnline, Betsson AB, Camelot UK Lotteries Ltd., Entain Plc, Flutter Entertainment Plc, Fortuna Entertainment Group AS, Galaxy Entertainment Group Ltd., INTRALOT SA, Kindred Group Plc, LeoVegas AB, MGM Resorts International, New York State Gaming Commission, Scientific Games LLC, Sportech Plc, The Betway Group, The Stars Group Inc., William Hill Plc, and Winamax |
Market dynamics | Parent market analysis, Market growth inducers and obstacles, Fast-growing and slow-growing segment analysis, COVID-19 impact and recovery analysis and future consumer dynamics, Market condition analysis for the forecast period |
Customization purview | If our report has not included the data that you are looking for, you can reach out to our analysts and get segments customized |
Table of Contents
1 Executive Summary
- 1.1 Market overview
- Exhibit 01: Executive Summary – Chart on Market Overview
- Exhibit 02: Executive Summary – Data Table on Market Overview
- Exhibit 03: Executive Summary – Chart on Global Market Characteristics
- Exhibit 04: Executive Summary – Chart on Market by Geography
- Exhibit 05: Executive Summary – Chart on Market Segmentation by Device
- Exhibit 06: Executive Summary – Chart on Market Segmentation by Product
- Exhibit 07: Executive Summary – Chart on Incremental Growth
- Exhibit 08: Executive Summary – Data Table on Incremental Growth
- Exhibit 09: Executive Summary – Chart on Vendor Market Positioning
2 Market Landscape
- 2.1 Market ecosystem
- Exhibit 10: Parent market
- Exhibit 11: Market Characteristics
3 Market Sizing
- 3.1 Market definition
- Exhibit 12: Offerings of vendors included in the market definition
- 3.2 Market segment analysis
- Exhibit 13: Market segments
- 3.3 Market size 2022
- 3.4 Market outlook: Forecast for 2022-2027
- Exhibit 14: Chart on Global - Market size and forecast 2022-2027 ($ billion)
- Exhibit 15: Data Table on Global - Market size and forecast 2022-2027 ($ billion)
- Exhibit 16: Chart on Global Market: Year-over-year growth 2022-2027 (%)
- Exhibit 17: Data Table on Global Market: Year-over-year growth 2022-2027 (%)
4 Historic Market Size
- 4.1 Global online gambling market 2017 - 2021
- Exhibit 18: Historic Market Size – Data Table on Global online gambling market 2017 - 2021 ($ billion)
- 4.2 Device Segment Analysis 2017 - 2021
- Exhibit 19: Historic Market Size – Device Segment 2017 - 2021 ($ billion)
- 4.3 Product Segment Analysis 2017 - 2021
- Exhibit 20: Historic Market Size – Product Segment 2017 - 2021 ($ billion)
- 4.4 Geography Segment Analysis 2017 - 2021
- Exhibit 21: Historic Market Size – Geography Segment 2017 - 2021 ($ billion)
- 4.5 Country Segment Analysis 2017 - 2021
- Exhibit 22: Historic Market Size – Country Segment 2017 - 2021 ($ billion)
5 Five Forces Analysis
- 5.1 Five forces summary
- Exhibit 23: Five forces analysis - Comparison between 2022 and 2027
- 5.2 Bargaining power of buyers
- Exhibit 24: Chart on Bargaining power of buyers – Impact of key factors 2022 and 2027
- 5.3 Bargaining power of suppliers
- Exhibit 25: Bargaining power of suppliers – Impact of key factors in 2022 and 2027
- 5.4 Threat of new entrants
- Exhibit 26: Threat of new entrants – Impact of key factors in 2022 and 2027
- 5.5 Threat of substitutes
- Exhibit 27: Threat of substitutes – Impact of key factors in 2022 and 2027
- 5.6 Threat of rivalry
- Exhibit 28: Threat of rivalry – Impact of key factors in 2022 and 2027
- 5.7 Market condition
- Exhibit 29: Chart on Market condition - Five forces 2022 and 2027
6 Market Segmentation by Device
- 6.1 Market segments
- Exhibit 30: Chart on Device - Market share 2022-2027 (%)
- Exhibit 31: Data Table on Device - Market share 2022-2027 (%)
- 6.2 Comparison by Device
- Exhibit 32: Chart on Comparison by Device
- Exhibit 33: Data Table on Comparison by Device
- 6.3 Desktop - Market size and forecast 2022-2027
- Exhibit 34: Chart on Desktop - Market size and forecast 2022-2027 ($ billion)
- Exhibit 35: Data Table on Desktop - Market size and forecast 2022-2027 ($ billion)
- Exhibit 36: Chart on Desktop - Year-over-year growth 2022-2027 (%)
- Exhibit 37: Data Table on Desktop - Year-over-year growth 2022-2027 (%)
- 6.4 Mobile - Market size and forecast 2022-2027
- Exhibit 38: Chart on Mobile - Market size and forecast 2022-2027 ($ billion)
- Exhibit 39: Data Table on Mobile - Market size and forecast 2022-2027 ($ billion)
- Exhibit 40: Chart on Mobile - Year-over-year growth 2022-2027 (%)
- Exhibit 41: Data Table on Mobile - Year-over-year growth 2022-2027 (%)
- 6.5 Market opportunity by Device
- Exhibit 42: Market opportunity by Device ($ billion)
- Exhibit 43: Data Table on Market opportunity by Device ($ billion)
7 Market Segmentation by Product
- 7.1 Market segments
- Exhibit 44: Chart on Product - Market share 2022-2027 (%)
- Exhibit 45: Data Table on Product - Market share 2022-2027 (%)
- 7.2 Comparison by Product
- Exhibit 46: Chart on Comparison by Product
- Exhibit 47: Data Table on Comparison by Product
- 7.3 Lottery - Market size and forecast 2022-2027
- Exhibit 48: Chart on Lottery - Market size and forecast 2022-2027 ($ billion)
- Exhibit 49: Data Table on Lottery - Market size and forecast 2022-2027 ($ billion)
- Exhibit 50: Chart on Lottery - Year-over-year growth 2022-2027 (%)
- Exhibit 51: Data Table on Lottery - Year-over-year growth 2022-2027 (%)
- 7.4 Betting - Market size and forecast 2022-2027
- Exhibit 52: Chart on Betting - Market size and forecast 2022-2027 ($ billion)
- Exhibit 53: Data Table on Betting - Market size and forecast 2022-2027 ($ billion)
- Exhibit 54: Chart on Betting - Year-over-year growth 2022-2027 (%)
- Exhibit 55: Data Table on Betting - Year-over-year growth 2022-2027 (%)
- 7.5 Casino - Market size and forecast 2022-2027
- Exhibit 56: Chart on Casino - Market size and forecast 2022-2027 ($ billion)
- Exhibit 57: Data Table on Casino - Market size and forecast 2022-2027 ($ billion)
- Exhibit 58: Chart on Casino - Year-over-year growth 2022-2027 (%)
- Exhibit 59: Data Table on Casino - Year-over-year growth 2022-2027 (%)
- 7.6 Market opportunity by Product
- Exhibit 60: Market opportunity by Product ($ billion)
- Exhibit 61: Data Table on Market opportunity by Product ($ billion)
8 Customer Landscape
- 8.1 Customer landscape overview
- Exhibit 62: Analysis of price sensitivity, lifecycle, customer purchase basket, adoption rates, and purchase criteria
9 Geographic Landscape
- 9.1 Geographic segmentation
- Exhibit 63: Chart on Market share by geography 2022-2027 (%)
- Exhibit 64: Data Table on Market share by geography 2022-2027 (%)
- 9.2 Geographic comparison
- Exhibit 65: Chart on Geographic comparison
- Exhibit 66: Data Table on Geographic comparison
- 9.3 North America - Market size and forecast 2022-2027
- Exhibit 67: Chart on North America - Market size and forecast 2022-2027 ($ billion)
- Exhibit 68: Data Table on North America - Market size and forecast 2022-2027 ($ billion)
- Exhibit 69: Chart on North America - Year-over-year growth 2022-2027 (%)
- Exhibit 70: Data Table on North America - Year-over-year growth 2022-2027 (%)
- 9.4 APAC - Market size and forecast 2022-2027
- Exhibit 71: Chart on APAC - Market size and forecast 2022-2027 ($ billion)
- Exhibit 72: Data Table on APAC - Market size and forecast 2022-2027 ($ billion)
- Exhibit 73: Chart on APAC - Year-over-year growth 2022-2027 (%)
- Exhibit 74: Data Table on APAC - Year-over-year growth 2022-2027 (%)
- 9.5 Europe - Market size and forecast 2022-2027
- Exhibit 75: Chart on Europe - Market size and forecast 2022-2027 ($ billion)
- Exhibit 76: Data Table on Europe - Market size and forecast 2022-2027 ($ billion)
- Exhibit 77: Chart on Europe - Year-over-year growth 2022-2027 (%)
- Exhibit 78: Data Table on Europe - Year-over-year growth 2022-2027 (%)
- 9.6 South America - Market size and forecast 2022-2027
- Exhibit 79: Chart on South America - Market size and forecast 2022-2027 ($ billion)
- Exhibit 80: Data Table on South America - Market size and forecast 2022-2027 ($ billion)
- Exhibit 81: Chart on South America - Year-over-year growth 2022-2027 (%)
- Exhibit 82: Data Table on South America - Year-over-year growth 2022-2027 (%)
- 9.7 Middle East and Africa - Market size and forecast 2022-2027
- Exhibit 83: Chart on Middle East and Africa - Market size and forecast 2022-2027 ($ billion)
- Exhibit 84: Data Table on Middle East and Africa - Market size and forecast 2022-2027 ($ billion)
- Exhibit 85: Chart on Middle East and Africa - Year-over-year growth 2022-2027 (%)
- Exhibit 86: Data Table on Middle East and Africa - Year-over-year growth 2022-2027 (%)
- 9.8 US - Market size and forecast 2022-2027
- Exhibit 87: Chart on US - Market size and forecast 2022-2027 ($ billion)
- Exhibit 88: Data Table on US - Market size and forecast 2022-2027 ($ billion)
- Exhibit 89: Chart on US - Year-over-year growth 2022-2027 (%)
- Exhibit 90: Data Table on US - Year-over-year growth 2022-2027 (%)
- 9.9 China - Market size and forecast 2022-2027
- Exhibit 91: Chart on China - Market size and forecast 2022-2027 ($ billion)
- Exhibit 92: Data Table on China - Market size and forecast 2022-2027 ($ billion)
- Exhibit 93: Chart on China - Year-over-year growth 2022-2027 (%)
- Exhibit 94: Data Table on China - Year-over-year growth 2022-2027 (%)
- 9.10 UK - Market size and forecast 2022-2027
- Exhibit 95: Chart on UK - Market size and forecast 2022-2027 ($ billion)
- Exhibit 96: Data Table on UK - Market size and forecast 2022-2027 ($ billion)
- Exhibit 97: Chart on UK - Year-over-year growth 2022-2027 (%)
- Exhibit 98: Data Table on UK - Year-over-year growth 2022-2027 (%)
- 9.11 Germany - Market size and forecast 2022-2027
- Exhibit 99: Chart on Germany - Market size and forecast 2022-2027 ($ billion)
- Exhibit 100: Data Table on Germany - Market size and forecast 2022-2027 ($ billion)
- Exhibit 101: Chart on Germany - Year-over-year growth 2022-2027 (%)
- Exhibit 102: Data Table on Germany - Year-over-year growth 2022-2027 (%)
- 9.12 Canada - Market size and forecast 2022-2027
- Exhibit 103: Chart on Canada - Market size and forecast 2022-2027 ($ billion)
- Exhibit 104: Data Table on Canada - Market size and forecast 2022-2027 ($ billion)
- Exhibit 105: Chart on Canada - Year-over-year growth 2022-2027 (%)
- Exhibit 106: Data Table on Canada - Year-over-year growth 2022-2027 (%)
- 9.13 Market opportunity by geography
- Exhibit 107: Market opportunity by geography ($ billion)
- Exhibit 108: Data Tables on Market opportunity by geography ($ billion)
10 Drivers, Challenges, and Trends
- 10.1 Market drivers
- 10.2 Market challenges
- 10.3 Impact of drivers and challenges
- Exhibit 109: Impact of drivers and challenges in 2022 and 2027
- 10.4 Market trends
11 Vendor Landscape
- 11.1 Overview
- 11.2 Vendor landscape
- Exhibit 110: Overview on Criticality of inputs and Factors of differentiation
- 11.3 Landscape disruption
- Exhibit 111: Overview on factors of disruption
- 11.4 Industry risks
- Exhibit 112: Impact of key risks on business
12 Vendor Analysis
- 12.1 Vendors covered
- Exhibit 113: Vendors covered
- 12.2 Market positioning of vendors
- Exhibit 114: Matrix on vendor position and classification
- 12.3 888 Holdings Plc
- Exhibit 115: 888 Holdings Plc - Overview
- Exhibit 116: 888 Holdings Plc - Business segments
- Exhibit 117: 888 Holdings Plc - Key news
- Exhibit 118: 888 Holdings Plc - Key offerings
- Exhibit 119: 888 Holdings Plc - Segment focus
- 12.4 Bet365 Group Ltd.
- Exhibit 120: Bet365 Group Ltd. - Overview
- Exhibit 121: Bet365 Group Ltd. - Product / Service
- Exhibit 122: Bet365 Group Ltd. - Key offerings
- 12.5 BetOnline
- Exhibit 123: BetOnline - Overview
- Exhibit 124: BetOnline - Product / Service
- Exhibit 125: BetOnline - Key offerings
- 12.6 Betsson AB
- Exhibit 126: Betsson AB - Overview
- Exhibit 127: Betsson AB - Product / Service
- Exhibit 128: Betsson AB - Key offerings
- 12.7 Camelot UK Lotteries Ltd.
- Exhibit 129: Camelot UK Lotteries Ltd. - Overview
- Exhibit 130: Camelot UK Lotteries Ltd. - Product / Service
- Exhibit 131: Camelot UK Lotteries Ltd. - Key offerings
- 12.8 Entain Plc
- Exhibit 132: Entain Plc - Overview
- Exhibit 133: Entain Plc - Business segments
- Exhibit 134: Entain Plc - Key news
- Exhibit 135: Entain Plc - Key offerings
- Exhibit 136: Entain Plc - Segment focus
- 12.9 Flutter Entertainment Plc
- Exhibit 137: Flutter Entertainment Plc - Overview
- Exhibit 138: Flutter Entertainment Plc - Business segments
- Exhibit 139: Flutter Entertainment Plc - Key news
- Exhibit 140: Flutter Entertainment Plc - Key offerings
- Exhibit 141: Flutter Entertainment Plc - Segment focus
- 12.10 Fortuna Entertainment Group AS
- Exhibit 142: Fortuna Entertainment Group AS - Overview
- Exhibit 143: Fortuna Entertainment Group AS - Product / Service
- Exhibit 144: Fortuna Entertainment Group AS - Key offerings
- 12.11 Galaxy Entertainment Group Ltd.
- Exhibit 145: Galaxy Entertainment Group Ltd. - Overview
- Exhibit 146: Galaxy Entertainment Group Ltd. - Business segments
- Exhibit 147: Galaxy Entertainment Group Ltd. - Key offerings
- Exhibit 148: Galaxy Entertainment Group Ltd. - Segment focus
- 12.12 INTRALOT SA
- Exhibit 149: INTRALOT SA - Overview
- Exhibit 150: INTRALOT SA - Business segments
- Exhibit 151: INTRALOT SA - Key offerings
- Exhibit 152: INTRALOT SA - Segment focus
- 12.13 Kindred Group Plc
- Exhibit 153: Kindred Group Plc - Overview
- Exhibit 154: Kindred Group Plc - Business segments
- Exhibit 155: Kindred Group Plc - Key offerings
- Exhibit 156: Kindred Group Plc - Segment focus
- 12.14 MGM Resorts International
- Exhibit 157: MGM Resorts International - Overview
- Exhibit 158: MGM Resorts International - Business segments
- Exhibit 159: MGM Resorts International - Key offerings
- Exhibit 160: MGM Resorts International - Segment focus
- 12.15 Scientific Games LLC
- Exhibit 161: Scientific Games LLC - Overview
- Exhibit 162: Scientific Games LLC - Business segments
- Exhibit 163: Scientific Games LLC - Key offerings
- Exhibit 164: Scientific Games LLC - Segment focus
- 12.16 The Betway Group
- Exhibit 165: The Betway Group - Overview
- Exhibit 166: The Betway Group - Key offerings
- 12.17 William Hill Plc
- Exhibit 167: William Hill Plc - Overview
- Exhibit 168: William Hill Plc - Business segments
- Exhibit 169: William Hill Plc - Key offerings
- Exhibit 170: William Hill Plc - Segment focus
13 Appendix
- 13.1 Scope of the report
- 13.2 Inclusions and exclusions checklist
- Exhibit 171: Inclusions checklist
- Exhibit 172: Exclusions checklist
- 13.3 Currency conversion rates for US$
- Exhibit 173: Currency conversion rates for US$
- 13.4 Research methodology
- Exhibit 174: Research methodology
- Exhibit 175: Validation techniques employed for market sizing
- Exhibit 176: Information sources
- 13.5 List of abbreviations
- Exhibit 177: List of abbreviations
About Us
Technavio is a leading global technology research and advisory company. Their research and analysis focuses on emerging market trends and provides actionable insights to help businesses identify market opportunities and develop effective strategies to optimize their market positions. With over 500 specialized analysts, Technavio's report library consists of more than 17,000 reports and counting, covering 800 technologies, spanning across 50 countries. Their client base consists of enterprises of all sizes, including more than 100 Fortune 500 companies. This growing client base relies on Technavio's comprehensive coverage, extensive research, and actionable market insights to identify opportunities in existing and potential markets and assess their competitive positions within changing market scenarios.
Contact
Technavio Research
Jesse Maida
Media & Marketing Executive
US: +1 844 364 1100
UK: +44 203 893 3200
Email: media@technavio.com
Website: www.technavio.com/


SOURCE Technavio
© 2024 Benzinga.com. Benzinga does not provide investment advice. All rights reserved.
Trade confidently with insights and alerts from analyst ratings, free reports and breaking news that affects the stocks you care about.

