


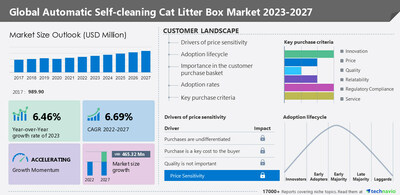
NEW YORK, Jan. 24, 2023 /PRNewswire/ -- According to Technavio, the global automatic self-cleaning cat litter box market size is estimated to grow by USD 465.32 million from 2022 to 2027. The market is estimated to grow at a CAGR of 6.69% during the forecast period. Moreover, the growth momentum will accelerate. North America will account for 48% of the market's growth during the forecast period.

For more insights on market size, request a sample report
Global automatic self-cleaning cat litter box market - Five forces
The global automatic self-cleaning cat litter box market is concentrated, and the five forces analysis covers–
- Bargaining power of buyers
- The threat of new entrants
- Threat of rivalry
- Bargaining power of suppliers
- Threat of substitutes
- For an interpretation of Porter's five forces model – buy the report!
Global automatic self-cleaning cat litter box market – Customer landscape
The report includes the market's adoption lifecycle, from the innovator's stage to the laggard's stage. It focuses on adoption rates in different regions based on penetration. Furthermore, the report also includes key purchase criteria and drivers of price sensitivity to help companies evaluate and develop their growth strategies.
Global automatic self-cleaning cat litter box market - Segmentation assessment
Technavio has segmented the market based on distribution channel (offline and online) and product (single cat and multi-cat).
- The offline segment will account for a significant share of the market's growth during the forecast period. Retail outlets help vendors retain existing customers as well as attract potential new customers, which can positively impact sales through the offline segment. These factors will, in turn, contribute to the growth of the global automatic self-cleaning cat litter box market during the forecast period.
Based on geography, the global automatic self-cleaning cat litter box market is segmented into North America, Europe, APAC, South America, and Middle East and Africa. The report provides actionable insights and estimates the contribution of all regions to the growth of the global automatic self-cleaning cat litter box market.
- North America is estimated to account for 48% of the growth of the global market during the forecast period. The growth of the pet industry, the pet food industry, and the pet insurance industry has positively impacted the global automatic self-cleaning cat litter box market growth in the region. Rising online sales, increase in pet ownership, adoption of smart pet care devices, advances in technology, and easy access to automatic self-cleaning cat litter boxes are also some of the key drivers.
Global automatic self-cleaning cat litter box market – Market dynamics
Key factor driving market growth
- The growing awareness about safety concerns and animal allergies is driving the growth of the market.
- Animals such as cats carry harmful bacteria such as Campylobacter jejuni and diseases such as cryptosporidiosis due to their exposure to several types of pollutants.
- An automatic litter box cleans animal litter without human effort and eliminates foul smells and the spread of any diseases.
- Thus, the growing awareness about safety concerns and animal allergies is expected to increase the demand for automatic self-cleaning cat litter boxes during the forecast period.
Leading trends influencing the market
- The growing inclination toward premiumization in pet care services is driving the automatic self-cleaning cat litter box market share growth.
- The growing number of dual-income households has led to changes in lifestyles.
- Pet owners prefer to provide their pets with the best services available, owing to the growing pet humanization culture, which is propelling the demand for automatic self-cleaning multi-cat litter boxes.
- As a result, pet service providers are offering niche services to customers.
- Such factors will support the growth of the market during the forecast period.
Major challenges hindering market growth
- The high purchase price and maintenance cost will challenge the automatic self-cleaning cat litter box market during the forecast period.
- Consumers incur high costs such as installation charges and other usage charges.
- The cost inclusions associated with the use of automatic self-cleaning cat litter boxes include monthly charges to Internet service providers; the cost of litter replacement filters and other replacement accessories; installation costs; and costs associated with protection, repair, and technological support.
- These additional costs restrict the adoption of self-cleaning cat litter boxes in developing and underdeveloped economies.
- These factors will impede the growth of the global automatic cat litter box market during the forecast period
What are the key data covered in this automatic self-cleaning cat litter box market report?
- CAGR of the market during the forecast period
- Detailed information on factors that will drive the growth of the automatic self-cleaning cat litter box market between 2023 and 2027
- Precise estimation of the size of the automatic self-cleaning cat litter box market and its contribution to the parent market
- Accurate predictions about upcoming trends and changes in consumer behavior
- Growth of the automatic self-cleaning cat litter box market industry across North America, Europe, APAC, South America, and Middle East and Africa
- A thorough analysis of the market's competitive landscape and detailed information about vendors
- Comprehensive analysis of factors that will challenge the growth of automatic self-cleaning cat litter box market vendors
Gain instant access to 17,000+ market research reports.
Technavio's SUBSCRIPTION platform
The pet accessories market is estimated to grow at a CAGR of 6.2% between 2022 and 2027. The size of the market is forecasted to increase by USD 13,243.92 million. This report extensively covers market segmentation by end-user (dogs, cats, and others), product (pet toys and others), distribution Channel (offline and online), and geography (North America, Europe, APAC, South America, and Middle East and Africa).
The smart-connected pet collars market size is expected to increase by USD 816.08 million from 2021 to 2026, and the market's growth momentum will accelerate at a CAGR of 14.47%. This report extensively covers smart-connected pet collars market segmentation by distribution channel (offline and online), application (dogs and cats), and geography (North America, Europe, APAC, South America, and the Middle East and Africa).
Automatic Self-cleaning Cat Litter Box Market Scope | |
Report Coverage | Details |
Page number | 153 |
Base year | 2022 |
Historic period | 2017-2021 |
Forecast period | 2023-2027 |
Growth momentum & CAGR | Accelerate at a CAGR of 6.69% |
Market growth 2023-2027 | USD 465.32 million |
Market structure | Concentrated |
YoY growth 2022-2023 (%) | 6.46 |
Regional analysis | North America, Europe, APAC, South America, and Middle East and Africa |
Performing market contribution | North America at 48% |
Key countries | US, Canada, China, Germany, and France |
Competitive landscape | Leading vendors, market positioning of vendors, competitive strategies, and industry risks |
Key companies profiled | Automated Pet Care Products LLC, Catlink, ChillX Co., Cosmic Pet, Hagen Group, iKuddle, Jiaxing Le you pet products Co. Ltd., Omega Paw Inc., PETKIT Ltd., PetNovations Ltd., Petree Litter Boxes, Smarty Pear, Spectrum Brands Holdings Inc., and Radio Systems Corp. |
Market dynamics | Parent market analysis, market growth inducers and obstacles, fast-growing and slow-growing segment analysis, COVID-19 impact and recovery analysis and future consumer dynamics, and market condition analysis for the forecast period. |
Customization purview | If our report has not included the data that you are looking for, you can reach out to our analysts and get segments customized. |
Browse for Technavio's consumer discretionary market reports
1 Executive Summary
- 1.1 Market overview
- Exhibit 01: Executive Summary – Chart on Market Overview
- Exhibit 02: Executive Summary – Data Table on Market Overview
- Exhibit 03: Executive Summary – Chart on Global Market Characteristics
- Exhibit 04: Executive Summary – Chart on Market by Geography
- Exhibit 05: Executive Summary – Chart on Market Segmentation by Distribution Channel
- Exhibit 06: Executive Summary – Chart on Market Segmentation by Product
- Exhibit 07: Executive Summary – Chart on Incremental Growth
- Exhibit 08: Executive Summary – Data Table on Incremental Growth
- Exhibit 09: Executive Summary – Chart on Vendor Market Positioning
2 Market Landscape
- 2.1 Market ecosystem
- Exhibit 10: Parent market
- Exhibit 11: Market Characteristics
3 Market Sizing
- 3.1 Market definition
- Exhibit 12: Offerings of vendors included in the market definition
- 3.2 Market segment analysis
- Exhibit 13: Market segments
- 3.3 Market size 2022
- 3.4 Market outlook: Forecast for 2022-2027
- Exhibit 14: Chart on Global - Market size and forecast 2022-2027 ($ million)
- Exhibit 15: Data Table on Global - Market size and forecast 2022-2027 ($ million)
- Exhibit 16: Chart on Global Market: Year-over-year growth 2022-2027 (%)
- Exhibit 17: Data Table on Global Market: Year-over-year growth 2022-2027 (%)
4 Historic Market Size
- 4.1 Global automatic self-cleaning cat litter box market 2017 - 2021
- Exhibit 18: Historic Market Size – Data Table on Global automatic self-cleaning cat litter box market 2017 - 2021 ($ million)
- 4.2 Distribution Channel Segment Analysis 2017 - 2021
- Exhibit 19: Historic Market Size – Distribution Channel Segment 2017 - 2021 ($ million)
- 4.3 Product Segment Analysis 2017 - 2021
- Exhibit 20: Historic Market Size – Product Segment 2017 - 2021 ($ million)
- 4.4 Geography Segment Analysis 2017 - 2021
- Exhibit 21: Historic Market Size – Geography Segment 2017 - 2021 ($ million)
- 4.5 Country Segment Analysis 2017 - 2021
- Exhibit 22: Historic Market Size – Country Segment 2017 - 2021 ($ million)
5 Five Forces Analysis
- 5.1 Five forces summary
- Exhibit 23: Five forces analysis - Comparison between 2022 and 2027
- 5.2 Bargaining power of buyers
- Exhibit 24: Chart on Bargaining power of buyers – Impact of key factors 2022 and 2027
- 5.3 Bargaining power of suppliers
- Exhibit 25: Bargaining power of suppliers – Impact of key factors in 2022 and 2027
- 5.4 Threat of new entrants
- Exhibit 26: Threat of new entrants – Impact of key factors in 2022 and 2027
- 5.5 Threat of substitutes
- Exhibit 27: Threat of substitutes – Impact of key factors in 2022 and 2027
- 5.6 Threat of rivalry
- Exhibit 28: Threat of rivalry – Impact of key factors in 2022 and 2027
- 5.7 Market condition
- Exhibit 29: Chart on Market condition - Five forces 2022 and 2027
6 Market Segmentation by Distribution Channel
- 6.1 Market segments
- Exhibit 30: Chart on Distribution Channel - Market share 2022-2027 (%)
- Exhibit 31: Data Table on Distribution Channel - Market share 2022-2027 (%)
- 6.2 Comparison by Distribution Channel
- Exhibit 32: Chart on Comparison by Distribution Channel
- Exhibit 33: Data Table on Comparison by Distribution Channel
- 6.3 Offline - Market size and forecast 2022-2027
- Exhibit 34: Chart on Offline - Market size and forecast 2022-2027 ($ million)
- Exhibit 35: Data Table on Offline - Market size and forecast 2022-2027 ($ million)
- Exhibit 36: Chart on Offline - Year-over-year growth 2022-2027 (%)
- Exhibit 37: Data Table on Offline - Year-over-year growth 2022-2027 (%)
- 6.4 Online - Market size and forecast 2022-2027
- Exhibit 38: Chart on Online - Market size and forecast 2022-2027 ($ million)
- Exhibit 39: Data Table on Online - Market size and forecast 2022-2027 ($ million)
- Exhibit 40: Chart on Online - Year-over-year growth 2022-2027 (%)
- Exhibit 41: Data Table on Online - Year-over-year growth 2022-2027 (%)
- 6.5 Market opportunity by Distribution Channel
- Exhibit 42: Market opportunity by Distribution Channel ($ million)
7 Market Segmentation by Product
- 7.1 Market segments
- Exhibit 43: Chart on Product - Market share 2022-2027 (%)
- Exhibit 44: Data Table on Product - Market share 2022-2027 (%)
- 7.2 Comparison by Product
- Exhibit 45: Chart on Comparison by Product
- Exhibit 46: Data Table on Comparison by Product
- 7.3 Single cat - Market size and forecast 2022-2027
- Exhibit 47: Chart on Single cat - Market size and forecast 2022-2027 ($ million)
- Exhibit 48: Data Table on Single cat - Market size and forecast 2022-2027 ($ million)
- Exhibit 49: Chart on Single cat - Year-over-year growth 2022-2027 (%)
- Exhibit 50: Data Table on Single cat - Year-over-year growth 2022-2027 (%)
- 7.4 Multi-cat - Market size and forecast 2022-2027
- Exhibit 51: Chart on Multi-cat - Market size and forecast 2022-2027 ($ million)
- Exhibit 52: Data Table on Multi-cat - Market size and forecast 2022-2027 ($ million)
- Exhibit 53: Chart on Multi-cat - Year-over-year growth 2022-2027 (%)
- Exhibit 54: Data Table on Multi-cat - Year-over-year growth 2022-2027 (%)
- 7.5 Market opportunity by Product
- Exhibit 55: Market opportunity by Product ($ million)
8 Customer Landscape
- 8.1 Customer landscape overview
- Exhibit 56: Analysis of price sensitivity, lifecycle, customer purchase basket, adoption rates, and purchase criteria
9 Geographic Landscape
- 9.1 Geographic segmentation
- Exhibit 57: Chart on Market share by geography 2022-2027 (%)
- Exhibit 58: Data Table on Market share by geography 2022-2027 (%)
- 9.2 Geographic comparison
- Exhibit 59: Chart on Geographic comparison
- Exhibit 60: Data Table on Geographic comparison
- 9.3 North America - Market size and forecast 2022-2027
- Exhibit 61: Chart on North America - Market size and forecast 2022-2027 ($ million)
- Exhibit 62: Data Table on North America - Market size and forecast 2022-2027 ($ million)
- Exhibit 63: Chart on North America - Year-over-year growth 2022-2027 (%)
- Exhibit 64: Data Table on North America - Year-over-year growth 2022-2027 (%)
- 9.4 Europe - Market size and forecast 2022-2027
- Exhibit 65: Chart on Europe - Market size and forecast 2022-2027 ($ million)
- Exhibit 66: Data Table on Europe - Market size and forecast 2022-2027 ($ million)
- Exhibit 67: Chart on Europe - Year-over-year growth 2022-2027 (%)
- Exhibit 68: Data Table on Europe - Year-over-year growth 2022-2027 (%)
- 9.5 APAC - Market size and forecast 2022-2027
- Exhibit 69: Chart on APAC - Market size and forecast 2022-2027 ($ million)
- Exhibit 70: Data Table on APAC - Market size and forecast 2022-2027 ($ million)
- Exhibit 71: Chart on APAC - Year-over-year growth 2022-2027 (%)
- Exhibit 72: Data Table on APAC - Year-over-year growth 2022-2027 (%)
- 9.6 South America - Market size and forecast 2022-2027
- Exhibit 73: Chart on South America - Market size and forecast 2022-2027 ($ million)
- Exhibit 74: Data Table on South America - Market size and forecast 2022-2027 ($ million)
- Exhibit 75: Chart on South America - Year-over-year growth 2022-2027 (%)
- Exhibit 76: Data Table on South America - Year-over-year growth 2022-2027 (%)
- 9.7 Middle East and Africa - Market size and forecast 2022-2027
- Exhibit 77: Chart on Middle East and Africa - Market size and forecast 2022-2027 ($ million)
- Exhibit 78: Data Table on Middle East and Africa - Market size and forecast 2022-2027 ($ million)
- Exhibit 79: Chart on Middle East and Africa - Year-over-year growth 2022-2027 (%)
- Exhibit 80: Data Table on Middle East and Africa - Year-over-year growth 2022-2027 (%)
- 9.8 US - Market size and forecast 2022-2027
- Exhibit 81: Chart on US - Market size and forecast 2022-2027 ($ million)
- Exhibit 82: Data Table on US - Market size and forecast 2022-2027 ($ million)
- Exhibit 83: Chart on US - Year-over-year growth 2022-2027 (%)
- Exhibit 84: Data Table on US - Year-over-year growth 2022-2027 (%)
- 9.9 China - Market size and forecast 2022-2027
- Exhibit 85: Chart on China - Market size and forecast 2022-2027 ($ million)
- Exhibit 86: Data Table on China - Market size and forecast 2022-2027 ($ million)
- Exhibit 87: Chart on China - Year-over-year growth 2022-2027 (%)
- Exhibit 88: Data Table on China - Year-over-year growth 2022-2027 (%)
- 9.10 Germany - Market size and forecast 2022-2027
- Exhibit 89: Chart on Germany - Market size and forecast 2022-2027 ($ million)
- Exhibit 90: Data Table on Germany - Market size and forecast 2022-2027 ($ million)
- Exhibit 91: Chart on Germany - Year-over-year growth 2022-2027 (%)
- Exhibit 92: Data Table on Germany - Year-over-year growth 2022-2027 (%)
- 9.11 Canada - Market size and forecast 2022-2027
- Exhibit 93: Chart on Canada - Market size and forecast 2022-2027 ($ million)
- Exhibit 94: Data Table on Canada - Market size and forecast 2022-2027 ($ million)
- Exhibit 95: Chart on Canada - Year-over-year growth 2022-2027 (%)
- Exhibit 96: Data Table on Canada - Year-over-year growth 2022-2027 (%)
- 9.12 France - Market size and forecast 2022-2027
- Exhibit 97: Chart on France - Market size and forecast 2022-2027 ($ million)
- Exhibit 98: Data Table on France - Market size and forecast 2022-2027 ($ million)
- Exhibit 99: Chart on France - Year-over-year growth 2022-2027 (%)
- Exhibit 100: Data Table on France - Year-over-year growth 2022-2027 (%)
- 9.13 Market opportunity by geography
- Exhibit 101: Market opportunity by geography ($ million)
10 Drivers, Challenges, and Trends
- 10.1 Market drivers
- 10.2 Market challenges
- 10.3 Impact of drivers and challenges
- Exhibit 102: Impact of drivers and challenges in 2022 and 2027
- 10.4 Market trends
11 Vendor Landscape
- 11.1 Overview
- 11.2 Vendor landscape
- Exhibit 103: Overview on Criticality of inputs and Factors of differentiation
- 11.3 Landscape disruption
- Exhibit 104: Overview on factors of disruption
- 11.4 Industry risks
- Exhibit 105: Impact of key risks on business
12 Vendor Analysis
- 12.1 Vendors covered
- Exhibit 106: Vendors covered
- 12.2 Market positioning of vendors
- Exhibit 107: Matrix on vendor position and classification
- 12.3 Automated Pet Care Products LLC
- Exhibit 108: Automated Pet Care Products LLC - Overview
- Exhibit 109: Automated Pet Care Products LLC - Product / Service
- Exhibit 110: Automated Pet Care Products LLC - Key offerings
- 12.4 Catlink
- Exhibit 111: Catlink - Overview
- Exhibit 112: Catlink - Product / Service
- Exhibit 113: Catlink - Key offerings
- 12.5 ChillX Co.
- Exhibit 114: ChillX Co. - Overview
- Exhibit 115: ChillX Co. - Product / Service
- Exhibit 116: ChillX Co. - Key offerings
- 12.6 Cosmic Pet
- Exhibit 117: Cosmic Pet - Overview
- Exhibit 118: Cosmic Pet - Product / Service
- Exhibit 119: Cosmic Pet - Key offerings
- 12.7 Hagen Group
- Exhibit 120: Hagen Group - Overview
- Exhibit 121: Hagen Group - Product / Service
- Exhibit 122: Hagen Group - Key offerings
- 12.8 iKuddle
- Exhibit 123: iKuddle - Overview
- Exhibit 124: iKuddle - Product / Service
- Exhibit 125: iKuddle - Key offerings
- 12.9 Jiaxing Le you pet products Co. Ltd.
- Exhibit 126: Jiaxing Le you pet products Co. Ltd. - Overview
- Exhibit 127: Jiaxing Le you pet products Co. Ltd. - Product / Service
- Exhibit 128: Jiaxing Le you pet products Co. Ltd. - Key offerings
- 12.10 Omega Paw Inc.
- Exhibit 129: Omega Paw Inc. - Overview
- Exhibit 130: Omega Paw Inc. - Product / Service
- Exhibit 131: Omega Paw Inc. - Key offerings
- 12.11 PETKIT Ltd.
- Exhibit 132: PETKIT Ltd. - Overview
- Exhibit 133: PETKIT Ltd. - Product / Service
- Exhibit 134: PETKIT Ltd. - Key offerings
- 12.12 PetNovations Ltd.
- Exhibit 135: PetNovations Ltd. - Overview
- Exhibit 136: PetNovations Ltd. - Product / Service
- Exhibit 137: PetNovations Ltd. - Key offerings
- 12.13 Petree Litter Boxes
- Exhibit 138: Petree Litter Boxes - Overview
- Exhibit 139: Petree Litter Boxes - Product / Service
- Exhibit 140: Petree Litter Boxes - Key offerings
- 12.14 Radio Systems Corp.
- Exhibit 141: Radio Systems Corp. - Overview
- Exhibit 142: Radio Systems Corp. - Product / Service
- Exhibit 143: Radio Systems Corp. - Key offerings
- 12.15 Smarty Pear
- Exhibit 144: Smarty Pear - Overview
- Exhibit 145: Smarty Pear - Product / Service
- Exhibit 146: Smarty Pear - Key offerings
- 12.16 Spectrum Brands Holdings Inc.
- Exhibit 147: Spectrum Brands Holdings Inc. - Overview
- Exhibit 148: Spectrum Brands Holdings Inc. - Business segments
- Exhibit 149: Spectrum Brands Holdings Inc. - Key news
- Exhibit 150: Spectrum Brands Holdings Inc. - Key offerings
- Exhibit 151: Spectrum Brands Holdings Inc. - Segment focus
13 Appendix
- 13.1 Scope of the report
- 13.2 Inclusions and exclusions checklist
- Exhibit 152: Inclusions checklist
- Exhibit 153: Exclusions checklist
- 13.3 Currency conversion rates for US$
- Exhibit 154: Currency conversion rates for US$
- 13.4 Research methodology
- Exhibit 155: Research methodology
- Exhibit 156: Validation techniques employed for market sizing
- Exhibit 157: Information sources
- 13.5 List of abbreviations
- Exhibit 158: List of abbreviations
Technavio is a leading global technology research and advisory company. Their research and analysis focus on emerging market trends and provide actionable insights to help businesses identify market opportunities and develop effective strategies to optimize their market positions. With over 500 specialized analysts, Technavio's report library consists of more than 17,000 reports and counting, covering 800 technologies, spanning across 50 countries. Their client base consists of enterprises of all sizes, including more than 100 Fortune 500 companies. This growing client base relies on Technavio's comprehensive coverage, extensive research, and actionable market insights to identify opportunities in existing and potential markets and assess their competitive positions within changing market scenarios.
Contact
Technavio Research
Jesse Maida
Media & Marketing Executive
US: +1 844 364 1100
UK: +44 203 893 3200
Email: media@technavio.com
Website: www.technavio.com/


SOURCE Technavio
© 2024 Benzinga.com. Benzinga does not provide investment advice. All rights reserved.
Trade confidently with insights and alerts from analyst ratings, free reports and breaking news that affects the stocks you care about.

